
Table of Contents
- 1. Summary
- 2. Introduction
- 3. Adoption and usage
- 4. Aggregate employment
- 5. Wages
- 6. Sectoral patterns
- 7. Whither software?
- 8. Authors
Summary
- Despite widespread concerns about the negative impact of AI on employment, we find no evidence that it has replaced jobs at scale in the UK. Annual Population Survey data covering 412 UK occupations shows no difference between occupations most and least exposed to AI.
- On the other hand, employer payroll data from the ONS shows that wages in occupations with high exposure to AI have grown more slowly than those with low-exposure since 2019. However, this trend predates the release of ChatGPT and cannot be easily explained as a response to AI.
- There has been a modest increase in the number of hours worked in AI-exposed occupations, relative to unexposed occupations, which is consistent with the idea that augmentation raises demand for workers in those roles.
- Within the most AI-exposed occupations, the aggregate picture hides variation. Contrary to a commonly-supposed view, the total number of roles for programmers and finance analysts has continued to grow, while administrative and clerical roles have contracted, since the deployment of ChatGPT. The same degree of AI exposure can produce different outcomes depending on whether the job's structure lends itself to augmentation or replacement.
- Adoption data (on what people actually use AI for) suggests that adoption is concentrated in specific tasks: roughly a fifth of all tasks account for the vast majority of usage.
- On the whole, the evidence suggests that AI is not replacing labour at scale at current adoption rates. AI is being used narrowly, concentrated on a small set of tasks, and the UK labour market data shows no consistent displacement signal even in the occupations most exposed on paper.
- None of these findings rule out larger effects ahead. But plausible near-term predictions are constrained by what adoption is actually doing now, not by what projected capabilities might suggest it could do.
Introduction
Whether AI will replace or augment human work is among the most consequential questions facing policymakers around the world, and it is no longer an abstract one. The companies building AI are often doing so on the explicit assumption that it will. OpenAI defines its goal as building systems that "outperform humans at most economically valuable work." Its CEO, Sam Altman, has said that Artificial General Intelligence (AGI) is within reach, and that "jobs are definitely going to go away, full stop." Jensen Huang, the CEO of NVIDIA, described AI agents as a "digital workforce" and told companies that their IT departments would become "the HR departments of AI agents." Klarna's CEO announced that the company's AI assistant was already doing the work of 700 customer service staff.
When it comes to investment, Cognition raised $175 million to build an AI marketed as "the first AI software engineer." OpenAI, SoftBank, Oracle, and MGX announced $100 billion of initial funding for AI data centre infrastructure under the Stargate project in January 2025, with up to $500 billion pledged over four years, on the premise that these systems will perform a substantial share of the world's cognitive labour within the decade.
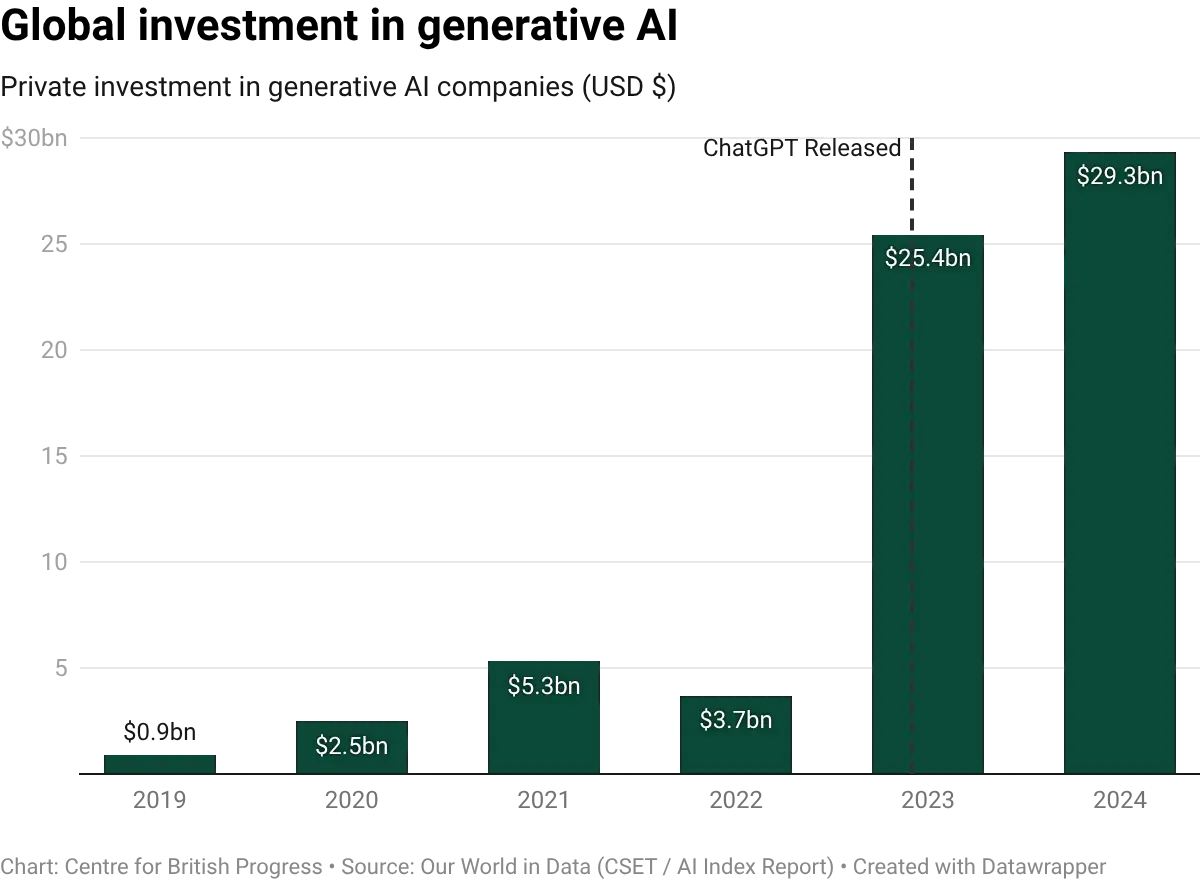
Collectively, the technology sector is deploying capital at a scale that can only be rationalised if a large fraction of current human work is on track to be automated – or become vastly more productive. Given the stakes, it is important that policymakers try to answer the question of whether AI will replace or augment labour.
An initial analysis of the data suggests that the impact of AI over the past three years has been broadly consistent with previous waves of technological transformation. This reshaping follows a pattern where total employment recovered through the creation of new kinds of work. But the indicators that would distinguish AI from previous waves of automation are only now becoming measurable, and we lack well-defined indicators of the potential threat posed by rapid adoption.
Electricity, computing, and the internet each promised to change everything and in the long run, they did. But for decades following their introduction, the data suggested they had changed almost nothing. Economic historian Paul David argued that electricity took roughly four decades to show up clearly in manufacturing productivity, to some extent because dynamos were slow, but also because there was significant resistance to reorganising factories around them. Robert Solow observed in a 1987 New York Times book review that you could “see the computer age everywhere except in the productivity statistics”.
When productivity growth finally accelerated in the late 1990s, economists rushed to account for the impact of information technology, and settled on a clear story: computers rewarded skilled workers, which explained rising wage inequality. But that explanation did not line up with the timing. Economists David Card and John DiNardo showed in the Journal of Labor Economics that inequality had already flattened in the 1990s, despite increasing computer adoption. Every single time, the underlying technological transformation was real, but some of the initial conjectures and predictions about their impact were not borne out.
This trend often results from asking the wrong questions when it comes to identifying the impact of new technologies on wider economic growth. One mistake is to treat annual productivity growth (of roughly 2%) at the technological frontier as a background rate, to which transformative technologies add a bonus. But that 2% is itself the product of overlapping waves of innovation, organisational adaptation, and capital deepening. It is not a baseline that passively delivers growth on default settings. Even after thirty years of data and observation, it can still be difficult to disentangle the additional contribution of transformative technologies to secular growth. Often, the question does not have a clean answer. Almost no new technology leaves a clear fingerprint, and the most transformative ones reshape economic activity so fundamentally that we can’t clearly identify their impact even after many decades.
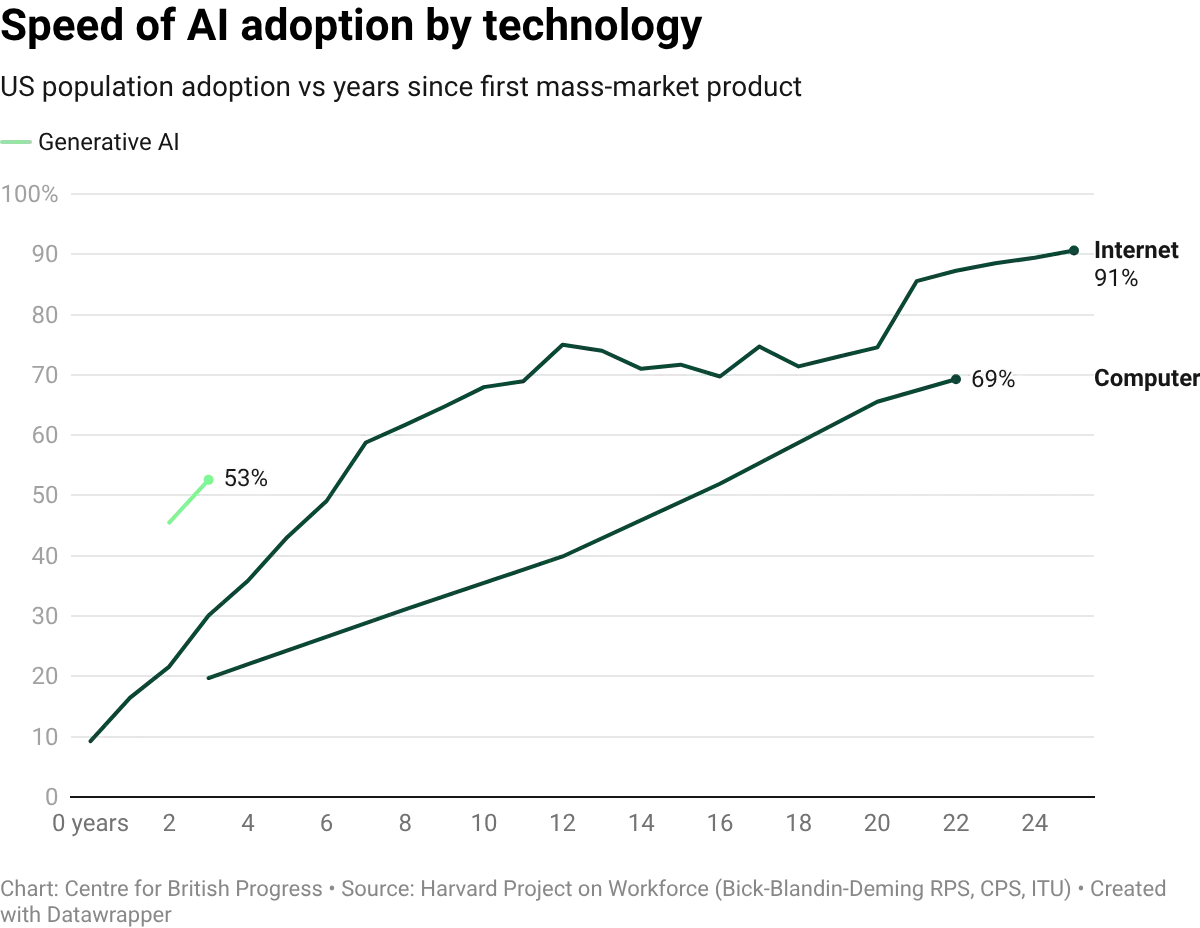
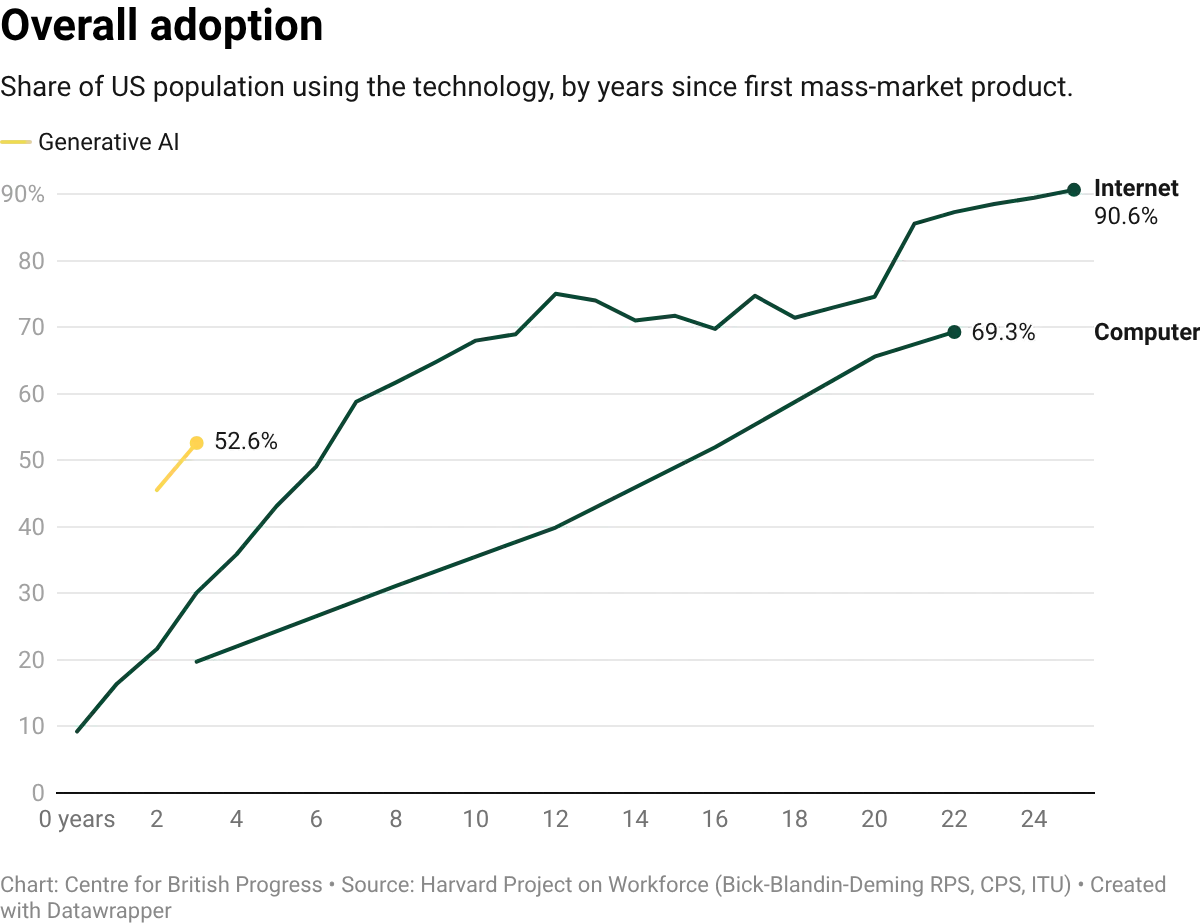
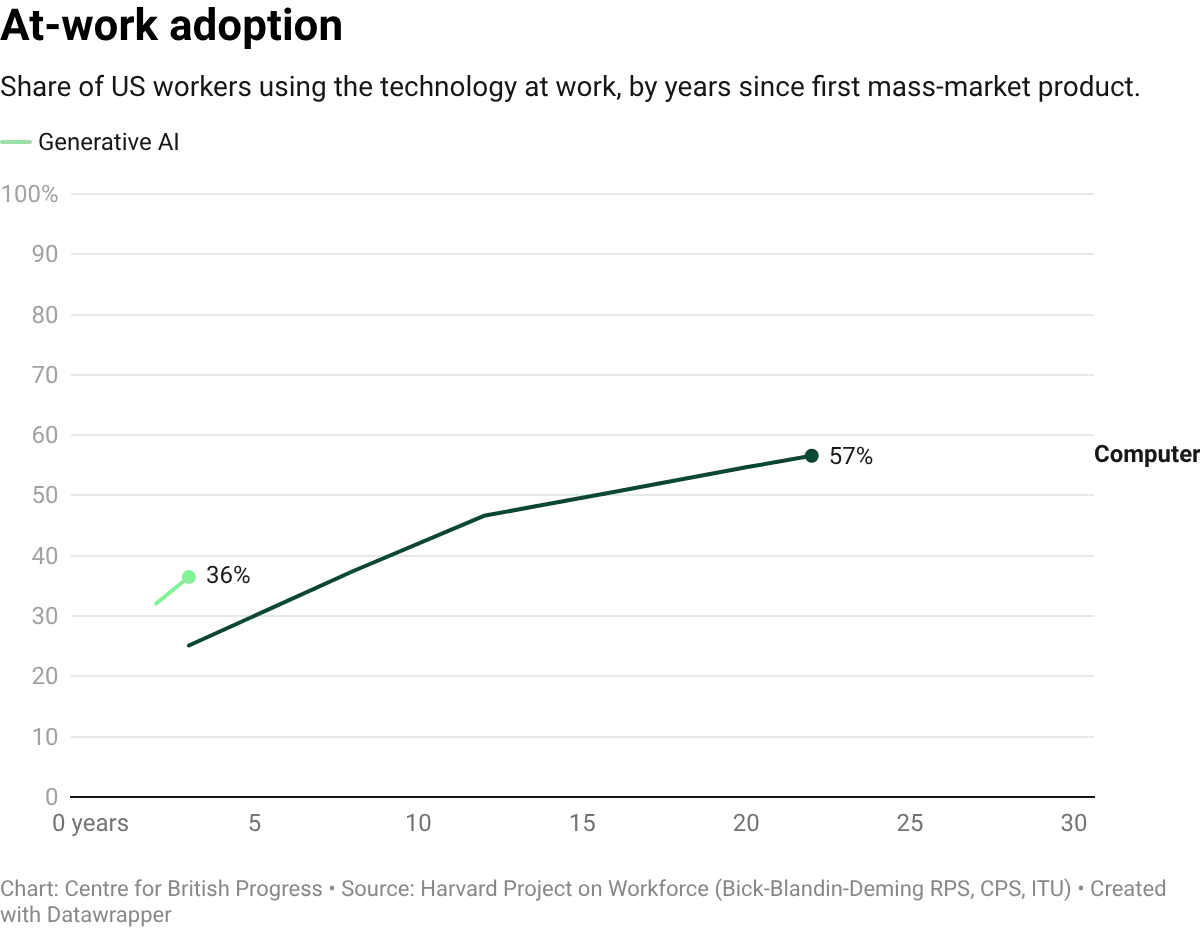
Despite the breakneck speed of some adoption, AI is earlier in this process than much of the current discussion suggests, particularly on economically meaningful adoption. While large language models (LLMs) only became widely available in late 2022, firm-level adoption is moving unusually fast: roughly 40% of large firms reported using AI tools by late 2025. But adoption of a tool and integration into production processes are different things, and we lack data to tell them apart. Measures like task-level reallocation within firms, changes in output per effective hour, and displacement versus augmentation require granular, high-frequency measurement that national statistical systems were never designed to provide, and that private sector surveys are only beginning to address.
Because AI is still in the early stages of adoption, the subsequent discussion is not meant to be a verdict on whether AI will transform the economy. It is an attempt to document what the available evidence shows at this early stage, and what we might expect in the immediate future.
The data we have relied on throughout is updated less frequently than we would like for a technology being deployed at the rate generative AI is currently being adopted both by households and companies. There are also standard concerns over how clearly labour market survey data can track real-time, real-world adoption of transformative technologies. This means we should interpret these findings with caution. They do not imply that AI has not had or will not have a significant and potentially negative impact on labour market outcomes. What it does tell us is that whatever impact it has had, we cannot yet see its fingerprint in the data. Close monitoring over the next few years will be critical for determining whether that will continue to be the case.
Adoption and usage
One of the leading AI companies, Anthropic, has begun publishing data on AI adoption around the world based on usage patterns for its models. Their Anthropic Economic Index (AEI) tracks the tasks that people perform with AI tools, mapped to the O*NET taxonomy (a US based project that classifies tasks and occupations in the US economy) of roughly 18,400 unique work tasks across 177 countries. It provides a measure of revealed adoption at the task level: not which jobs could theoretically be automated, but which tasks people are already delegating to AI in practice. This also includes information on usage levels for specific tasks at the level of specific roles.
How much does the UK use AI?
UK workers currently use AI across 385 distinct work tasks, roughly 2.1% of the 18,429 unique task statements identified in the O*NET database. These tasks range from the granular to the broad: drafting and proofreading legal opinions, adapting teaching materials to different types of learners, or tailoring sales scripts to specific customers are all distinct ONET entries. The same number for the US is 1,563, a considerable gap that largely reflects the size of the US economy. Countries with a larger number of users have more tasks that cross the threshold for inclusion in the dataset. This means raw coverage figures are not necessarily informative of the degree of adoption, because we cannot fully adjust for the size of a country.
Therefore, while the gap between the US and UK appears significant, in practice it is narrower than it appears: when the comparison is restricted to tasks adopted in at least ten different countries, both the UK and the US cover all of them. When expanded further to tasks identified in at least five different countries, the UK is second, with 94% of those covered. The UK largely matches the pattern of adoption for advanced economies across task types, but doesn’t have enough users performing less common tasks, to a significant extent because of its smaller population relative to the US.
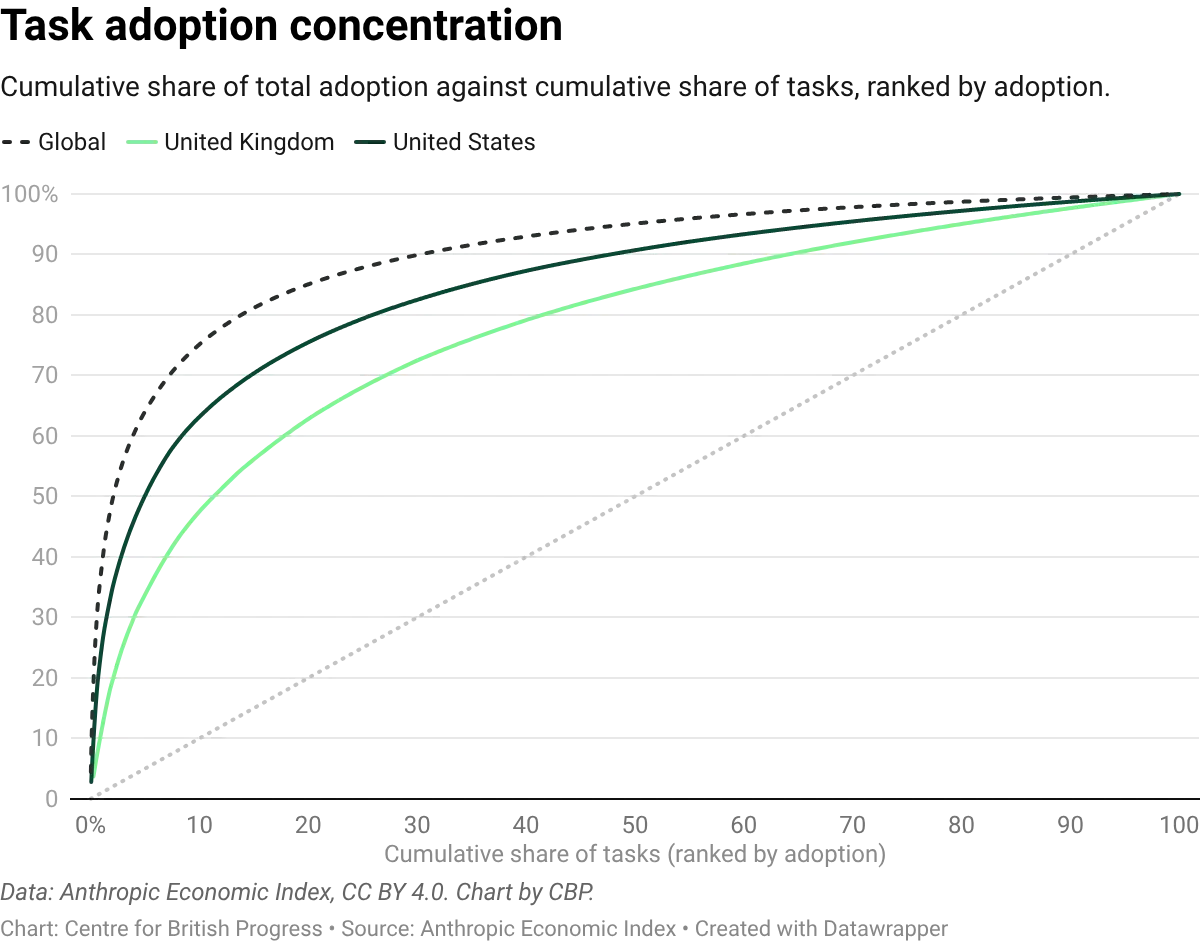
UK usage is also unusually broad. A given batch of UK conversations (a conversation being one user session of back-and-forth with Claude) covers more distinct O*NET tasks than an equivalent batch from the US, France, Germany, Italy, or Spain. The top handful of tasks look similar across countries: debugging computer programs, helping students with coursework, analysing user needs for software projects, and developing instructional materials for teachers all feature prominently in both the UK and the US. What differs is the weight of the tail. Across observed tasks, the top fifth accounts for 63% of classified UK activity but 76% of classified US activity. The UK's heavier use of secondary tasks (editing and evaluating manuscripts, writing advertising copy, gathering competitor intelligence, composing responses to correspondence) is what pulls its distribution flatter. Across all countries, however, roughly a fifth of tasks still account for the vast majority of AI usage, and a handful dominate in both the UK and the US.
This concentration constrains the pace at which widespread labour market effects are likely to show up, though not necessarily their eventual size. If heavily-used tasks sit in large occupations, even concentrated adoption can move aggregate numbers: debugging code alone touches hundreds of thousands of UK programmers and IT support workers. If instead those tasks are spread thinly across many jobs, aggregate effects will require adoption to broaden across the task space, not just deepen in tasks already captured. Either way, for widespread employment shifts to appear, adoption needs to move beyond the current handful of dominant tasks. Given its flatter distribution, the UK is a useful place to watch this question: if broad-based effects begin to materialise anywhere, they should become visible here earlier than in countries where usage clusters more tightly on a small set of heavyweights.
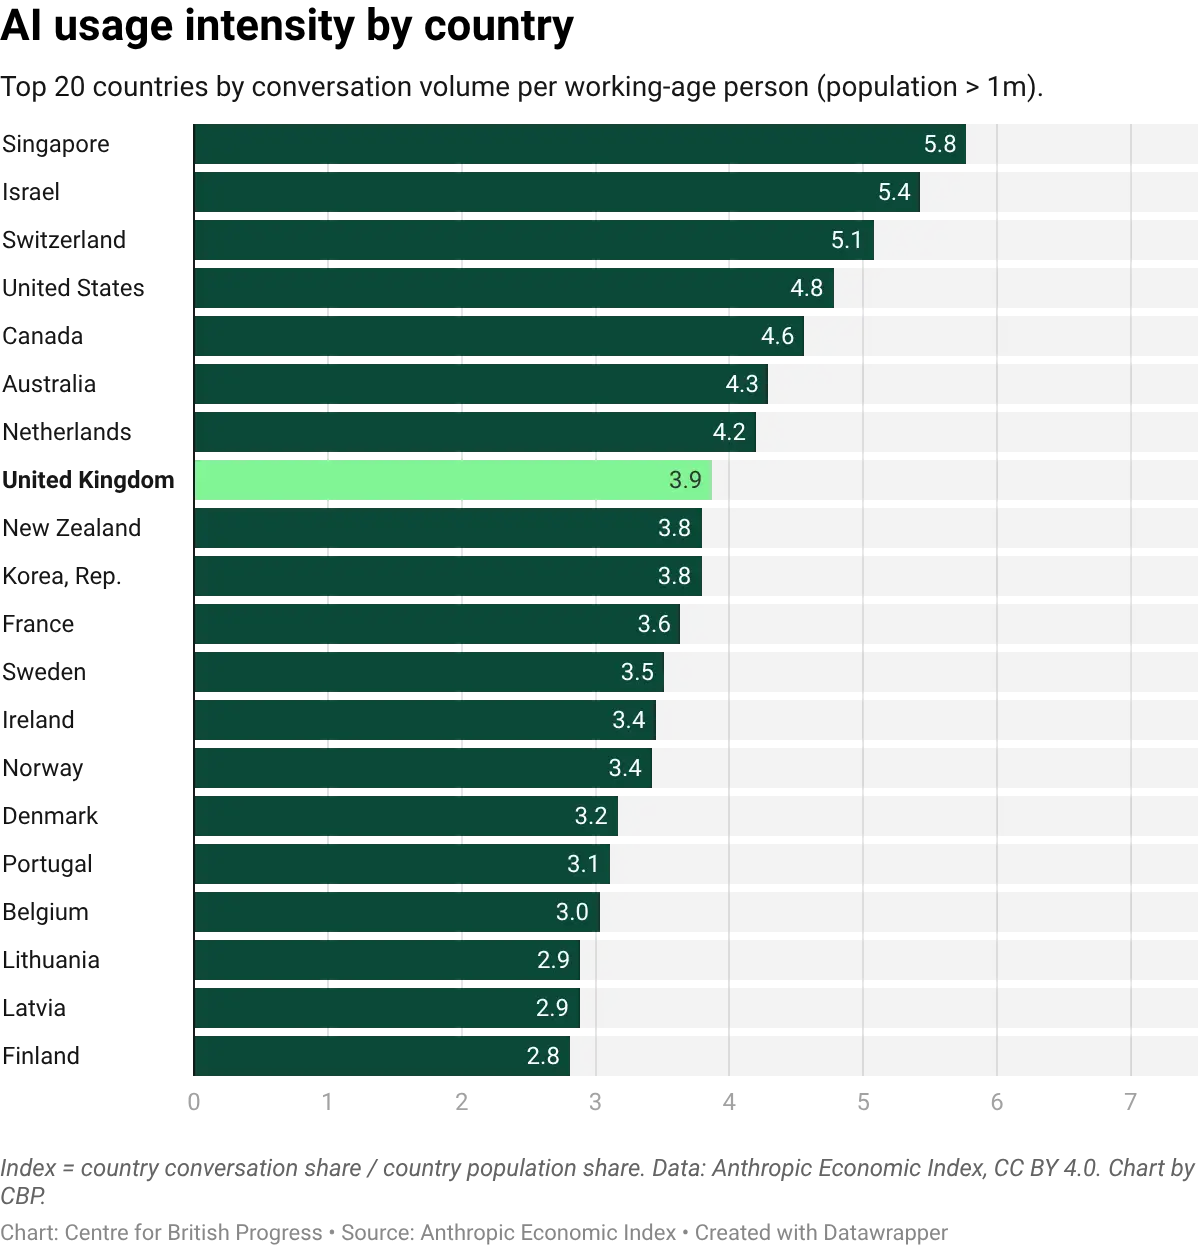
Per-capita usage intensity tells a related story. The UK ranks ninth among the twenty countries most intensive in their use of Claude, at 2.7 times its population share. Israel, Singapore, and Australia lead at 4 to 7 times their share; the United States sits at 3.6 times. The UK is therefore firmly within the leading group of AI-adopting economies, though not at the frontier. Taken together with the task-level evidence, the picture is of a country that combines unusually broad task coverage with a solid, if not leading, per-capita intensity: UK users reach into more parts of the task space than most peers, and do so at an intensity that sits well above the global median but below the handful of frontier adopters.
How AI is used
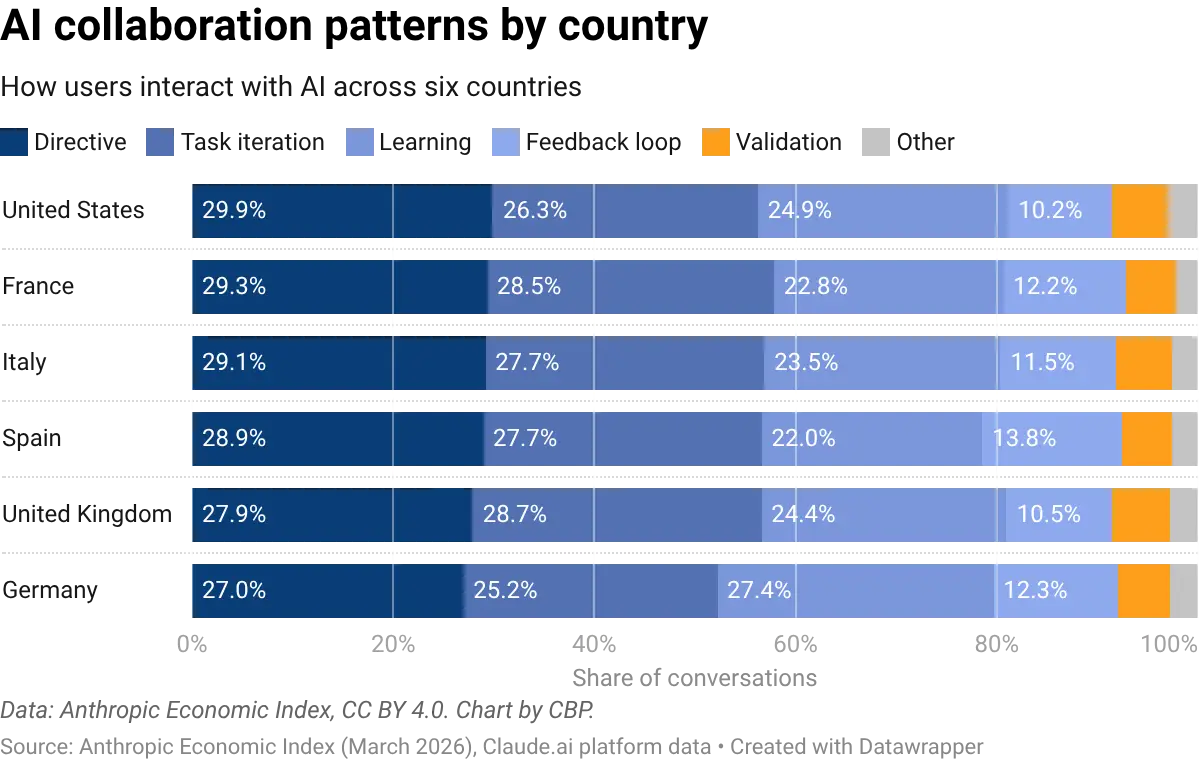
The Anthropic Economic Index classifies how people interact with AI across five collaboration types. In the UK, the most common are task iteration (29% of interactions) and directive use (28%), followed by learning (24%), feedback loops (11%), and validation (6%). The pattern is similar in the United States and across all advanced economies surveyed, with modest variation between countries.
These patterns will likely shift as adoption matures. In occupations with the lowest AI adoption, learning-focused interactions dominate: workers are exploring what the technology can do. In the highest-adoption occupations, task iteration takes over: workers are using AI as a production tool, refining outputs through back-and-forth exchanges. More interestingly, directive usage does not seem to vary significantly between occupations with different levels of exposure, and is surprisingly stable across all levels.
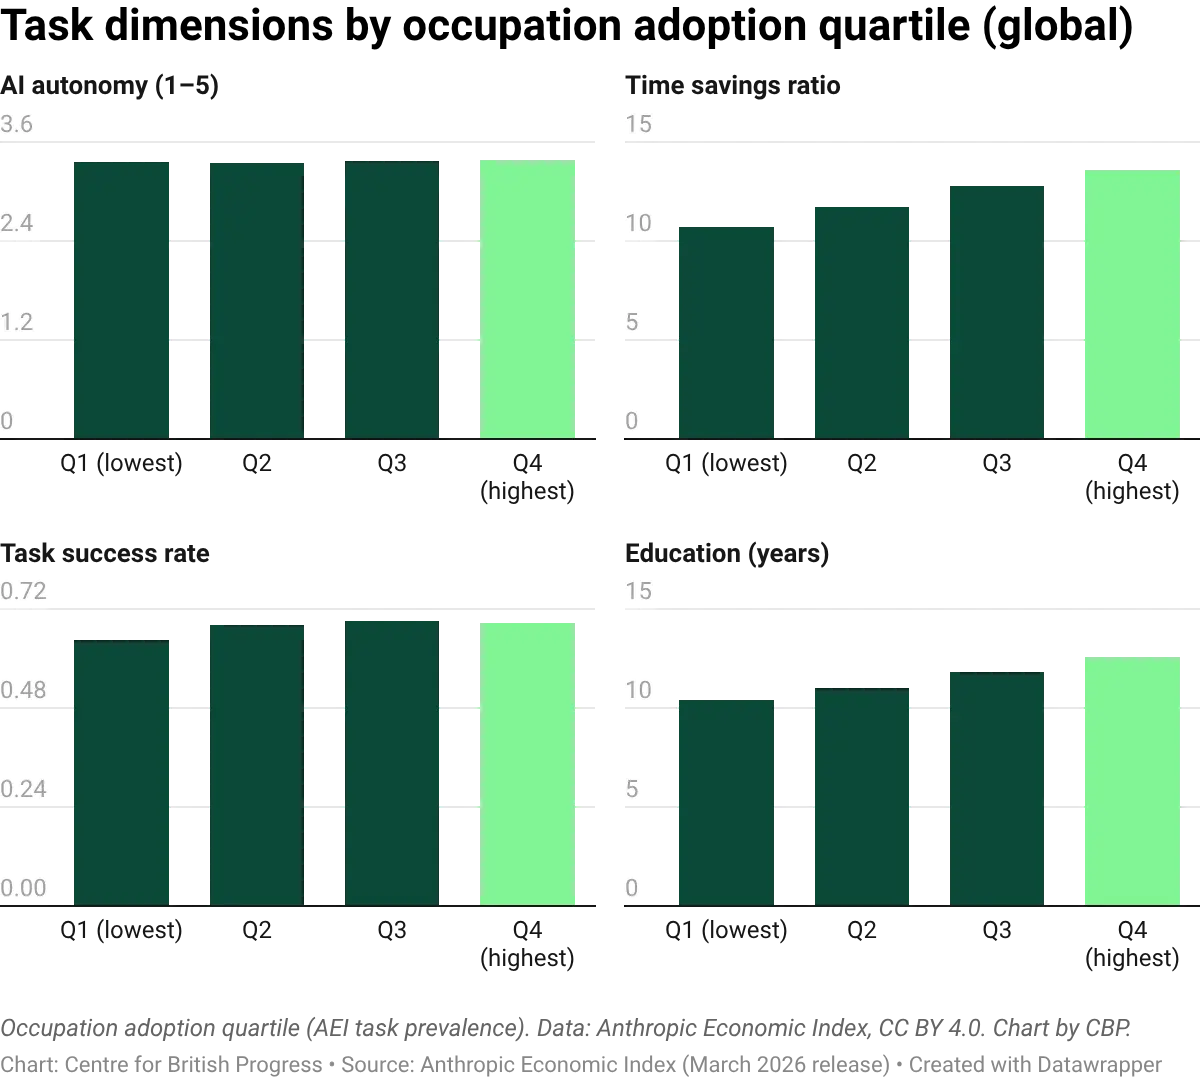
AI autonomy (the degree to which AI completes tasks independently) is flat across all adoption quartiles, at roughly 3.4 out of 5. Occupations that use AI intensively do not give it more independence than occupations that use minimally. This could be a reflection of jobs and roles as “bundles of tasks”: some of these may be relatively trivial and easy to automate no matter how sophisticated the job bundle, with all jobs having a number of tasks that are not easily automated.
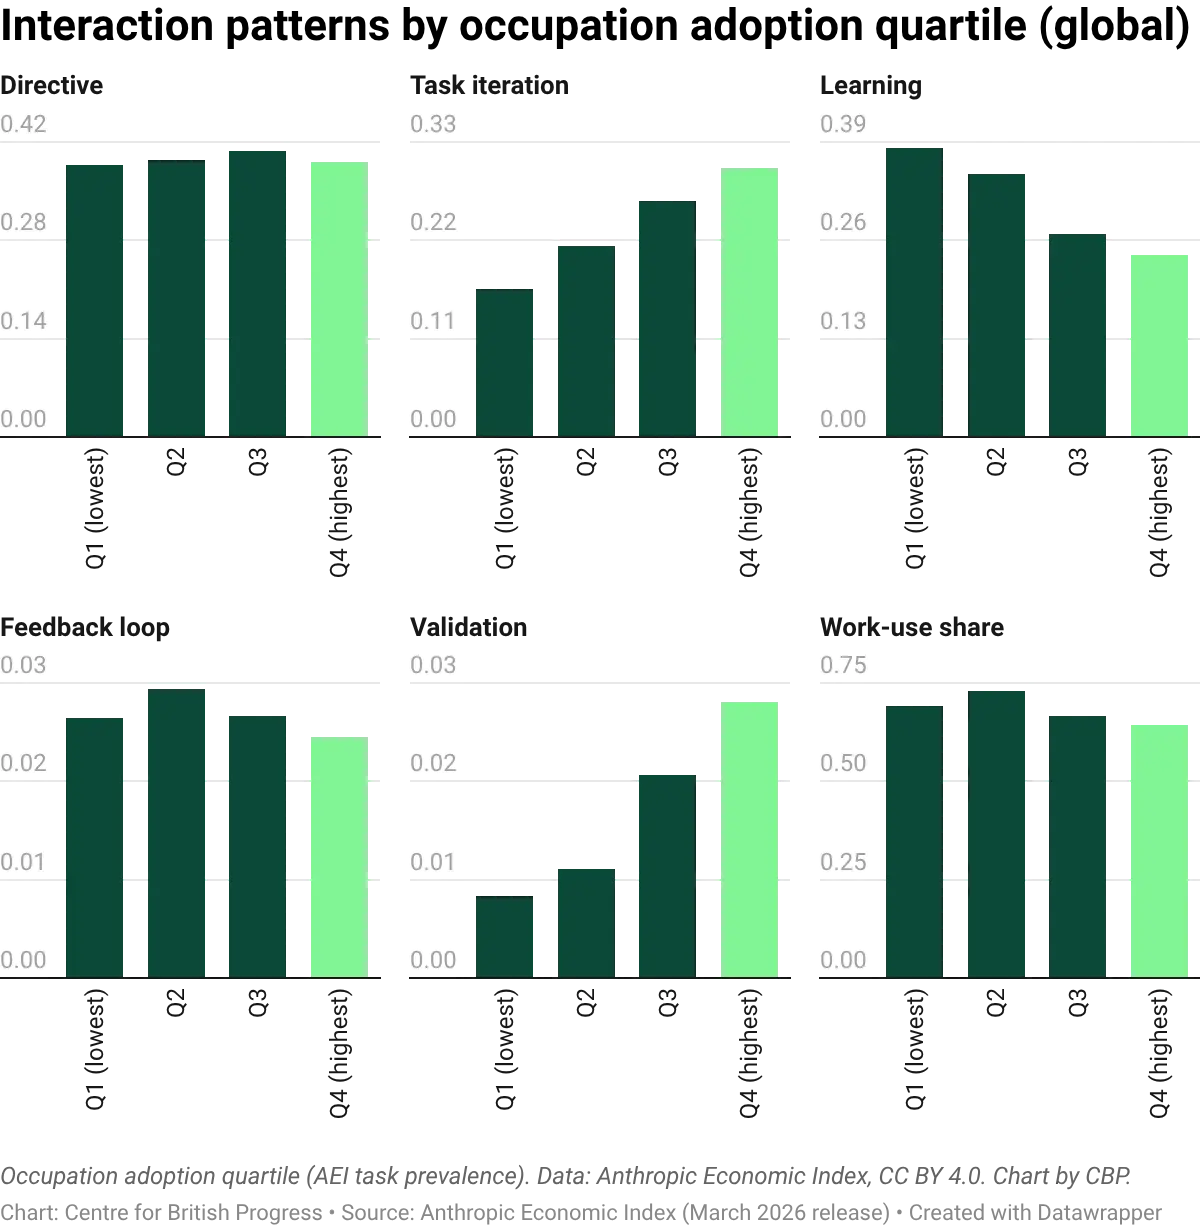
The occupations with the highest AI adoption are more likely to involve tasks typically requiring at least upper-secondary qualifications (A-levels or equivalent), while the lowest-adoption occupations cluster around lower-secondary level (GCSE or below). AI adoption is concentrated among higher-skilled workers performing tasks where the technology works reliably, consistent with augmentation rather than routine-task replacement.
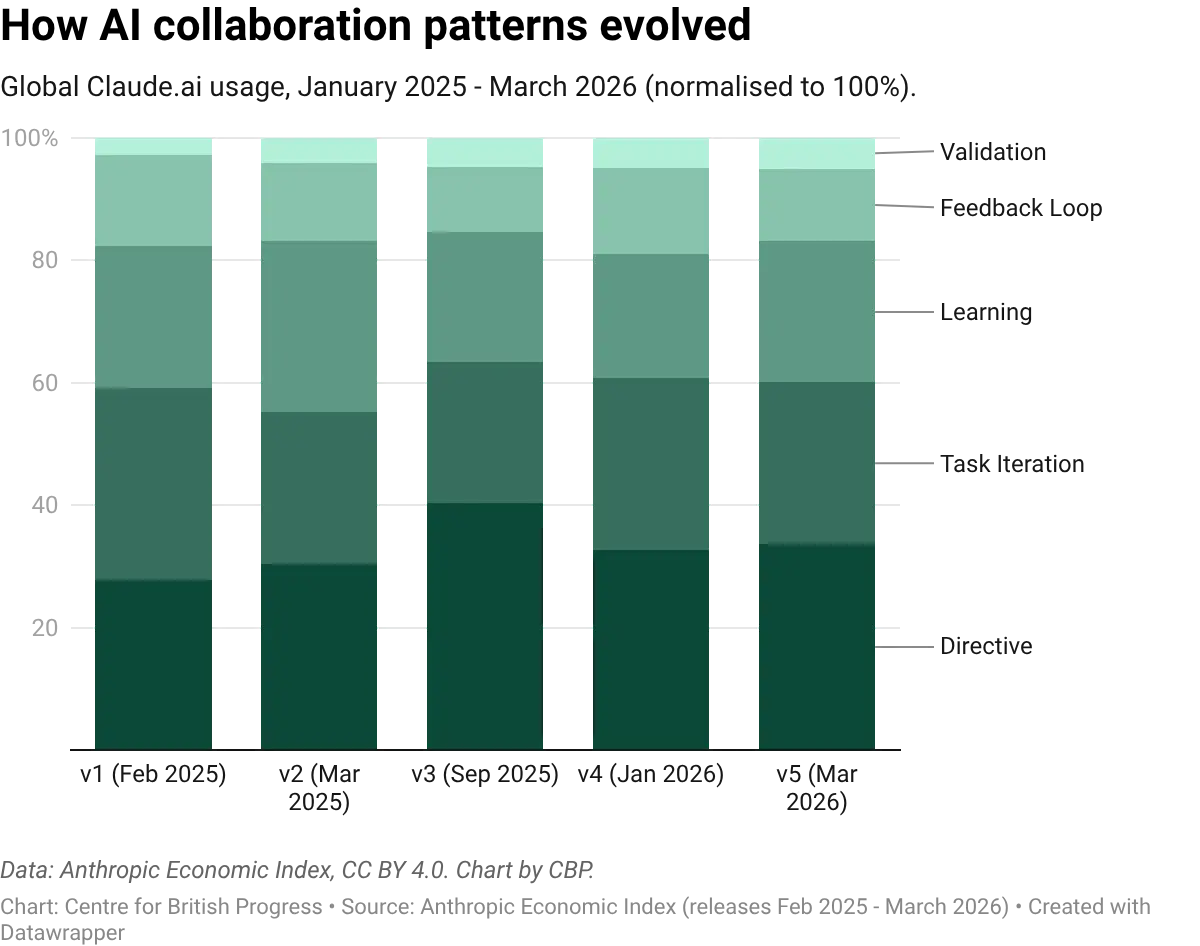
These collaboration patterns have been broadly stable across five AEI releases, spanning February 2025 to March 2026. The share of directive and iterative use has fluctuated modestly, but the overall composition does not exhibit a marked trend over this short period of time. In particular, there is no observable upward trend in AI autonomy or delegation, which might be expected if workers were progressively handing control to AI as the technology improved. That said, a flat overall average is consistent with autonomy rising within individual tasks: new tasks (where AI autonomy typically starts low) may be entering the pool faster than mature tasks reach full automation, keeping the mean steady. Initial occupation level analysis for a few select occupations doesn’t change these conclusions, but there has been too little time to adequately capture any meaningful changes in work patterns.
Predicted versus revealed
Most projections of AI's labour market impact rely on expert assessments of which tasks AI is most likely to automate. The two most widely cited rankings are:
- The ILO's task-based exposure index, which has domain experts rate each O*NET task for whether generative AI could perform it, which is then aggregated to occupation-level scores.
- The Eloundou et al., (2023) metric, in which GPT-4 and a panel of trained human annotators each rate whether a large language model could halve the time needed to complete each O*NET task. The two sets of ratings are then aggregated into a single occupation-level exposure score.
These can be contrasted against two alternative metrics based on actual usage data to produce a direct test: how well do these predictions match what people actually use AI for? The correlation between predicted exposure and adoption is positive but imperfect. Occupations that experts rate as highly exposed tend to show higher revealed adoption. But there is nevertheless considerable divergence. Some occupations that score highly on predicted exposure show little real-world AI usage; others adopt far beyond what the scores would suggest.
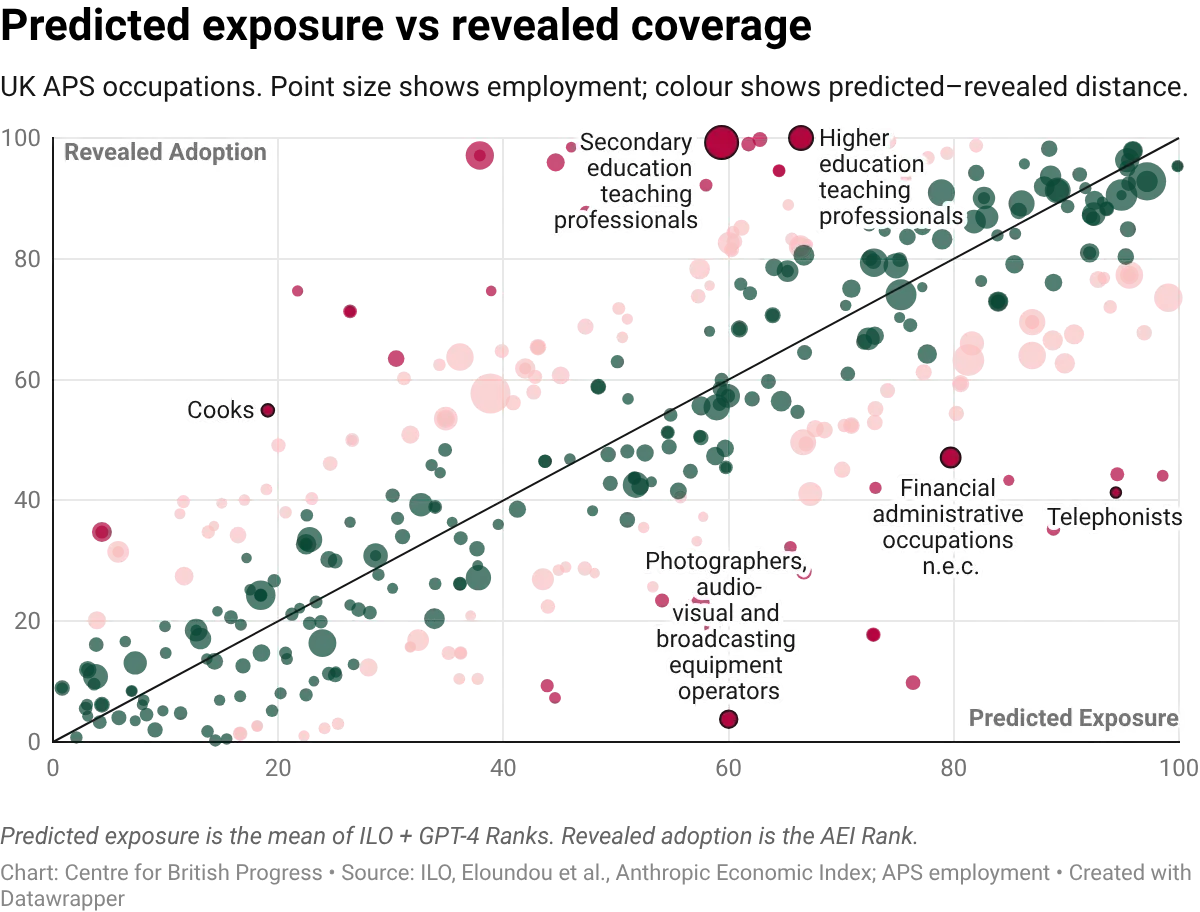
We can quantify the degree of over or understatement by looking at the distribution of the adoption gap. When we subtract predicted exposure ranks from revealed adoption ranks, we find that the resulting distribution has a fat left tail: more occupations have lower adoption than their exposure scores would suggest. The median occupation is adopted less intensively than prediction-based frameworks imply. This is not a calibration issue with one index. It holds for the ILO measure, the Eloundou et al. (2023) metric that is partly based on GPT-4 self-assessment, and the average of both. Ex ante measures generally overstate how much adoption we should expect to see across all occupations.
The gap between predicted and revealed exposure is also not uniform across the labour market. Professional and managerial occupations show the widest divergence: experts rate them as highly exposed, but actual AI usage lags well behind. Administrative and associate professional roles show a narrower gap. Skilled trades, caring, and elementary occupations score low on both measures. This pattern has been stable across three AEI releases (Sep 2025, Jan 2026, March 2026).
The gap between prediction and practice matters because many projections of large and fast AI economic impact (the Goldman Sachs estimate of a 7% boost to global GDP, the McKinsey projection of 12 million occupational transitions) are primarily prediction-based. They estimate what AI could do if organisations adopted it fully across all technically feasible tasks. The adoption data suggests real usage patterns are narrower, more selective, and more collaborative than we might assume beforehand. Of course, this may simply reflect that we are at the very early stage of a J-curve of adoption, where companies and workers are still learning how to integrate a new technology into their workflows.
This evidence also highlights the importance of understanding how AI adoption could eventually replace roles in practice. Exam invigilators, for instance, are among the occupations most at risk of automation based on actual usage, but there are good reasons to expect opposition to removing humans from the assessment loop, such as educational institutions wanting to protect their reputational credibility by keeping humans in the loop.
Measuring exposure: four approaches
We build the remainder of this report on four measures of AI exposure. Two are the prediction-based ones already discussed:
- The ILO task-based index, which scores occupations by the share of their tasks that AI could technically perform,
- The Eloundou et al. (2023) metric, in which GPT-4 and trained human annotators each rate whether a large language model could halve the time needed for each O*NET task.
Another two are based on usage patterns:
- A measure of revealed adoption, constructed from the Anthropic Economic Index (AEI). Anthropic classifies millions of real Claude conversations against O*NET task descriptions; we match these to UK occupations through standard crosswalks (tables that translate US O*NET codes into UK SOC2020 codes) and, for each occupation, compute the fraction of its O*NET tasks that appear in the usage data at all. The resulting score captures adoption breadth: not how intensively AI is used on any given task, but rather how many of an occupation's tasks have any observed AI usage.
- A fourth and final measure is observed exposure from Massenkoff and McCrory (2026), which weights each task by both AI penetration and the share of working time it absorbs, giving more weight to automated than augmentative uses. The third measure and Massenkoff-McCrory’s both draw on revealed behaviour, but they answer different questions: ours measures adoption breadth (which tasks attract AI demand), while Massenkoff-McCrory measures displacement risk (how much working time falls within AI's substitution frontier).
Given the variation in what each of the measures is capturing, it is worth keeping the difference between them in mind. Overall results should be treated with caution when they rely too heavily on a single one of these measures, but are more robust where the same finding is observed across all four of them.
Aggregate employment
The most important measure to track, and the most direct test of the impact of automation, is employment: i.e. the number of roles by occupation. We build our exposure metrics on the Annual Population Survey/Labour Force Survey’s data on NOMIS. It provides rolling 12-month employment counts for 412 occupations from 2004 to 2025, with 24.8 million full-time workers in the latest period. We rank these occupations using all four of the measures we described, and compare the most and least exposed quintiles on the relevant outcomes.
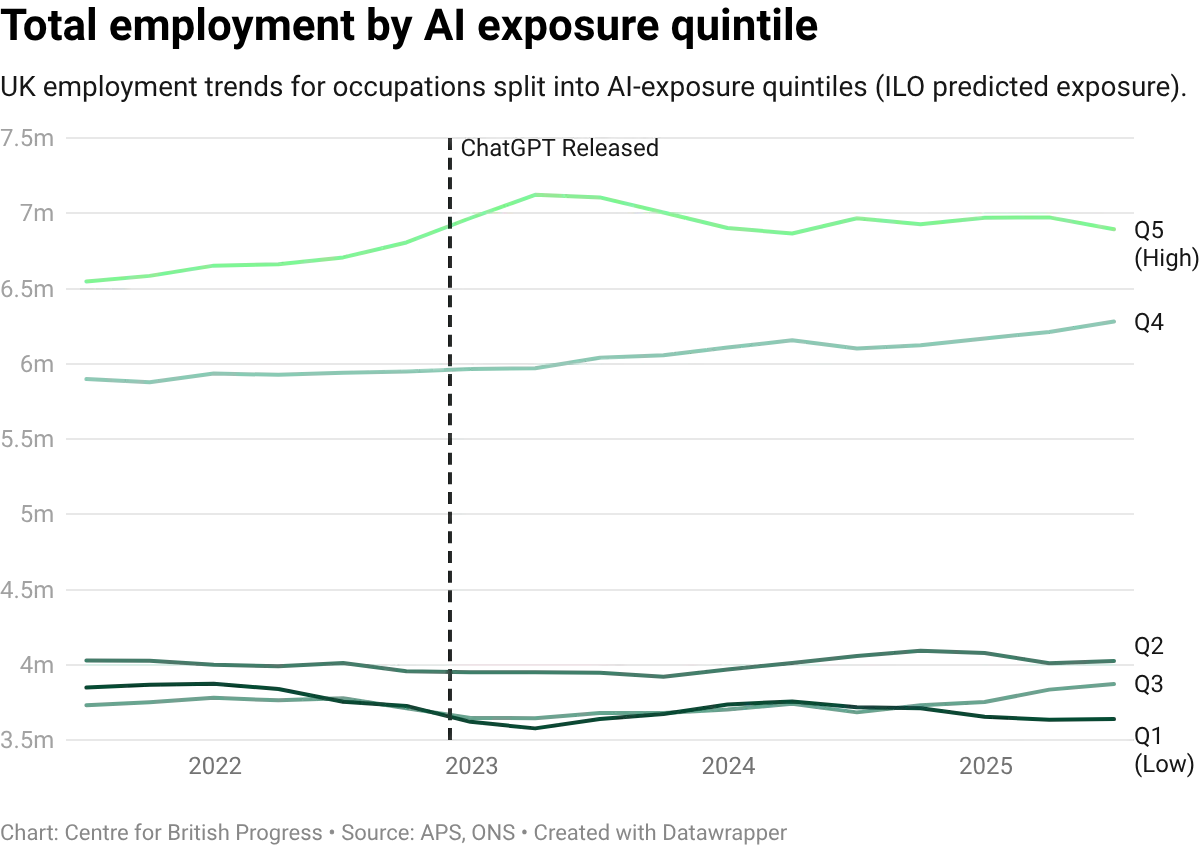
We performed statistical analysis that accounts for persistent differences between occupations, and for economy-wide shifts that affect all occupations equally, and then traced how the gap between high-exposure and low-exposure occupations has evolved over time. Across all four measures, the estimates are marginally positive: AI-exposed occupations, if anything, experienced marginally faster cumulative growth since the release of ChatGPT.
While the estimates are small relative to how uncertain they are, they are consistent with an increase in employment in the most exposed occupations, as opposed to large and immediate job losses that would be associated with imminent displacement of human labour. This uncertainty means that we cannot firmly distinguish between modest growth and no effect at all, nor make strong predictions over what impact the technology may start to have over the near-term.
Employment in the more AI-exposed occupations has been flat for roughly 18 months. However, for that stall to reflect an AI effect, the less-exposed occupations should have pulled ahead in relative terms; they have not. A simpler explanation is that there aren’t yet any observable impacts on aggregate labour market figures. Despite our controls for aggregate factors, the stability in employment figures may largely reflect steady macroeconomic conditions in a low-growth environment, rather than any occupation-level effect of AI.
A somewhat more interesting result arises from extending the data further back in time. This requires allowing the composition of each quintile to adjust over time - because what counts as a more exposed occupation varies over time and occupations themselves are redefined. This reveals a pattern of relatively faster growth in more exposed occupations since the COVID-19 pandemic - more jobs in high-exposure occupations have been added in recent years than in the pre-pandemic period.
Even with a longer window, we still cannot identify any large negative employment effects for the most exposed occupations. Visual inspection of cumulative growth in employment since 2004 for the most and least exposed occupations suggests that more exposed jobs have been growing faster since at least 2016, if not longer. There does not appear to be any significant deviation from this trend following the introduction of ChatGPT: at the time of the latest publication, there was still no identifiable, meaningful employment effect.
This insight holds across all measures of exposure and adoption. Differences in the overall composition of the metrics result in substantial divergence in cumulative growth rates, but they broadly depict the same underlying pattern of a secular increase of employment in more exposed occupations, which has not yet been reversed. Any reversal of this pattern could be suggestive of initial signs of a greater degree of automation across the whole economy, and could serve as an early signal of more significant labour market impacts.
In short, when it comes to employment, all specifications show broadly similar results: no clear signal in either direction. The estimates are noisy, the confidence intervals are wide, and neither measure produces a statistically distinguishable effect on aggregate employment. This is the main finding: three years after generative AI reached the market, there is no detectable employment effect for the most exposed occupations on UK data, regardless of which exposure metric is used.
However, this result is not uniform across occupations: since 2021, IT business analysts grew by 38% and programmers by 18%, while call centre workers contracted by 19% and telephone salespersons by 23%. The same exposure score can be associated with completely opposite employment outcomes depending on the specific occupation. This variation suggests that exposure measures alone are insufficient to predict the direction of AI's effect on any given occupation, and that additional characteristics of the job matter. Identifying what those characteristics are and testing whether they predict the direction of the effect is a priority for future work.
The broader pattern of employment over the last two decades suggests that the UK has experienced considerable growth in those roles that are more exposed to automation, which is consistent with growth in professional services and other areas of knowledge work and a relative decline of sectors like manufacturing. This makes timely identification of labour market impacts especially important in a UK context. The continued growth of high-exposure occupations is, for now, welcome news. But it also points to a specific vulnerability: if adoption eventually concentrates on the occupations that have driven UK employment growth since the 2010s (professional services, software, analytics), the very composition that has been an engine of job creation could turn into a testing ground for mass displacement.
Wages
In addition to the Annual Population Survey/Labour Force Survey, the UK’s Office for National Statistics publishes a survey on employer-reported payroll data on median annual pay, the Annual Survey of Hours and Earnings (ASHE). This publication also includes data on the number of roles and hours worked. This allows us to expand our analysis to both compensation for specific occupations and the overall number of hours of work. Our findings on overall employment are corroborated by this source, but wages and hours worked paint a slightly different picture. To begin with, wages in high-exposure occupations have grown more slowly than wages in low-exposure ones over the entire 2011-2025 panel.
But this gap is unlikely to be due to AI. The divergence shows up clearly in the data from around 2019, two to three years before ChatGPT was released. Whatever is driving the relative wage compression in AI-exposed roles, it was already underway before any large language model reached the market. Because the gap predates the supposed cause, we cannot treat it as evidence of an AI effect: this pattern appears to be more structural and to predate 2022. We do not investigate the potential drivers of this compression, but relatively weak productivity growth coupled with an increase in statutory minimum compensation would likely produce the observed impact. Median and average wages are driven by market mechanisms, while pay at the lower end of the distribution is more responsive to changes in minimum wages.
Median annual pay in the most-exposed quintile grew broadly in line with the least-exposed quintile through the mid-2010s, then began to lag from around 2019. The gap widened gradually rather than opening as a post-2022 shock.
Wage distribution
The distributional detail is broadly consistent with this. For entry-level wages (proxied as the tenth percentile of pay within each occupation), the differential between exposed and unexposed occupations is roughly flat, with no clear decline. But at higher points in the within-occupation distribution, the premium has fallen further. Wages in the most exposed occupations have eroded more than wages in the less exposed ones. The erosion is larger at the top, suggesting that the wage premium associated with AI-relevant skills has been declining across the board. This compression is likely affected by other policy determinants, and may in turn account for the relatively better performance of these occupations in terms of employment outcomes.
At the 25th percentile, there is a greater suggestion of erosion in the premium that more exposed occupations have traditionally earned over less exposed ones, even though we cannot rule out a zero effect. Unlike entry wages, which have held roughly steady, lower-quartile wages in high-exposure occupations show more of a decline in their premium over low-exposure ones. The gap has closed steadily since the early 2010s, reaching approximately zero by the post-ChatGPT period.
At the 75th percentile, the picture is similar. Upper-quartile wages in high-exposure occupations have eroded by roughly the same margin and on a similar timeline, suggesting the compression is broad-based across the within-occupation pay distribution rather than concentrated at any particular point. We can, however, disentangle this further by looking at the ratio of wages between the 75th and the 25th percentiles, and assessing its evolution.
Carrying out this exercise suggests that, within high-exposure occupations, the gap between the best-paid and lowest-paid workers in the same job has narrowed relative to the equivalent gap in low-exposure occupations, driven by upper-quartile wages eroding faster than lower-quartile ones. This is consistent with a broad compression of the wage premium for more AI-exposed occupations, visible across the pay distribution but strongest at the top.
Hours worked
Hours worked provide a complementary test. ASHE records usual weekly hours by occupation, allowing the same differential-trends comparison applied to wages. The result shows a modest increase in hours for high-exposure occupations relative to low-exposure ones, particularly in the ILO and GPT-4 panels, though the estimates are imprecise and the revealed-coverage measures show less of a signal.
The direction is consistent with the idea that augmentation raises demand for workers in exposed occupations: the theory is that if AI makes these workers more productive, firms want more of their time, not less. The confidence intervals include zero, so we cannot yet rule out a nil effect, and this is an indicator worth tracking as the ASHE panel extends.
Sectoral patterns
AI exposure is not evenly distributed across the economy, nor is the degree to which it has been adopted. Finance and business services, public administration and health, and other services are the most exposed sectors on all four measures: the ILO task-based index, GPT-4's self-assessment, revealed adoption from the AEI, and the composite observed score. Agriculture, construction, and distribution are the least exposed. The ordering is broadly consistent across measures, though the predicted indices tend to assign higher scores than revealed adoption.
Sector-level employment trends show no clear divergence by exposure level. Employment has grown in high-exposure sectors like information and communication and professional and scientific services, and has also grown in low-exposure sectors like construction and transport and storage, if at a slower pace. The visible level shift around 2021 reflects a transition in classification codes, not a real employment discontinuity. Either side of that boundary, the trajectories of high- and low-exposure sectors are broadly parallel. This pattern holds at the sectoral level: occupations more exposed to AI show no clear employment effects regardless of which sector they sit in. If anything, visual inspection of the time trends is suggestive of faster employment growth in sectors with occupations more exposed to AI, rather than slower.
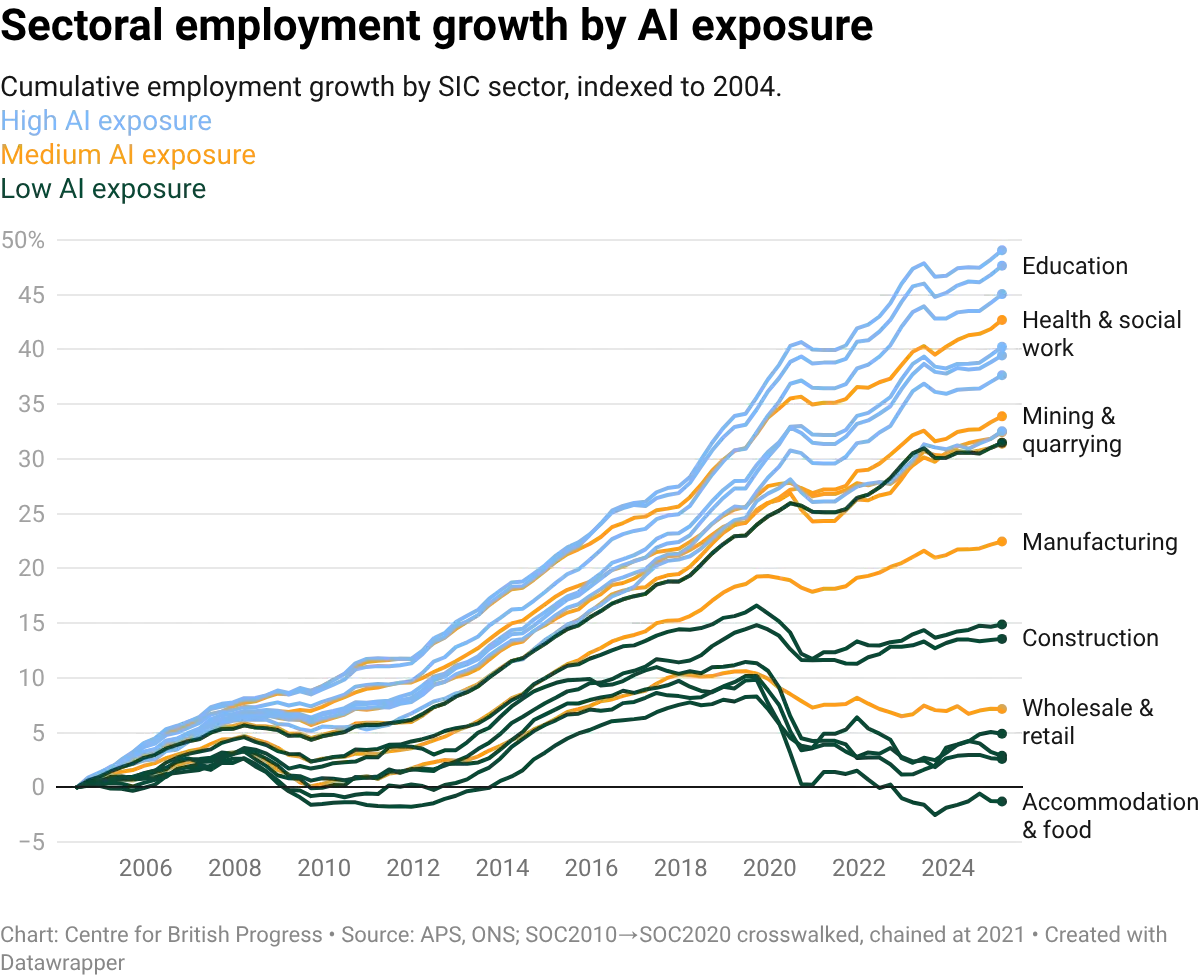
The occupation mix within each sector reveals which parts of the economy are most exposed at the task level. Finance and insurance, for instance, has high average exposure but the intensity varies across its constituent occupations: analysts and advisers rank much higher on AI exposure than back-office roles, which were already automated to a large extent by software that preceded generative AI tools.
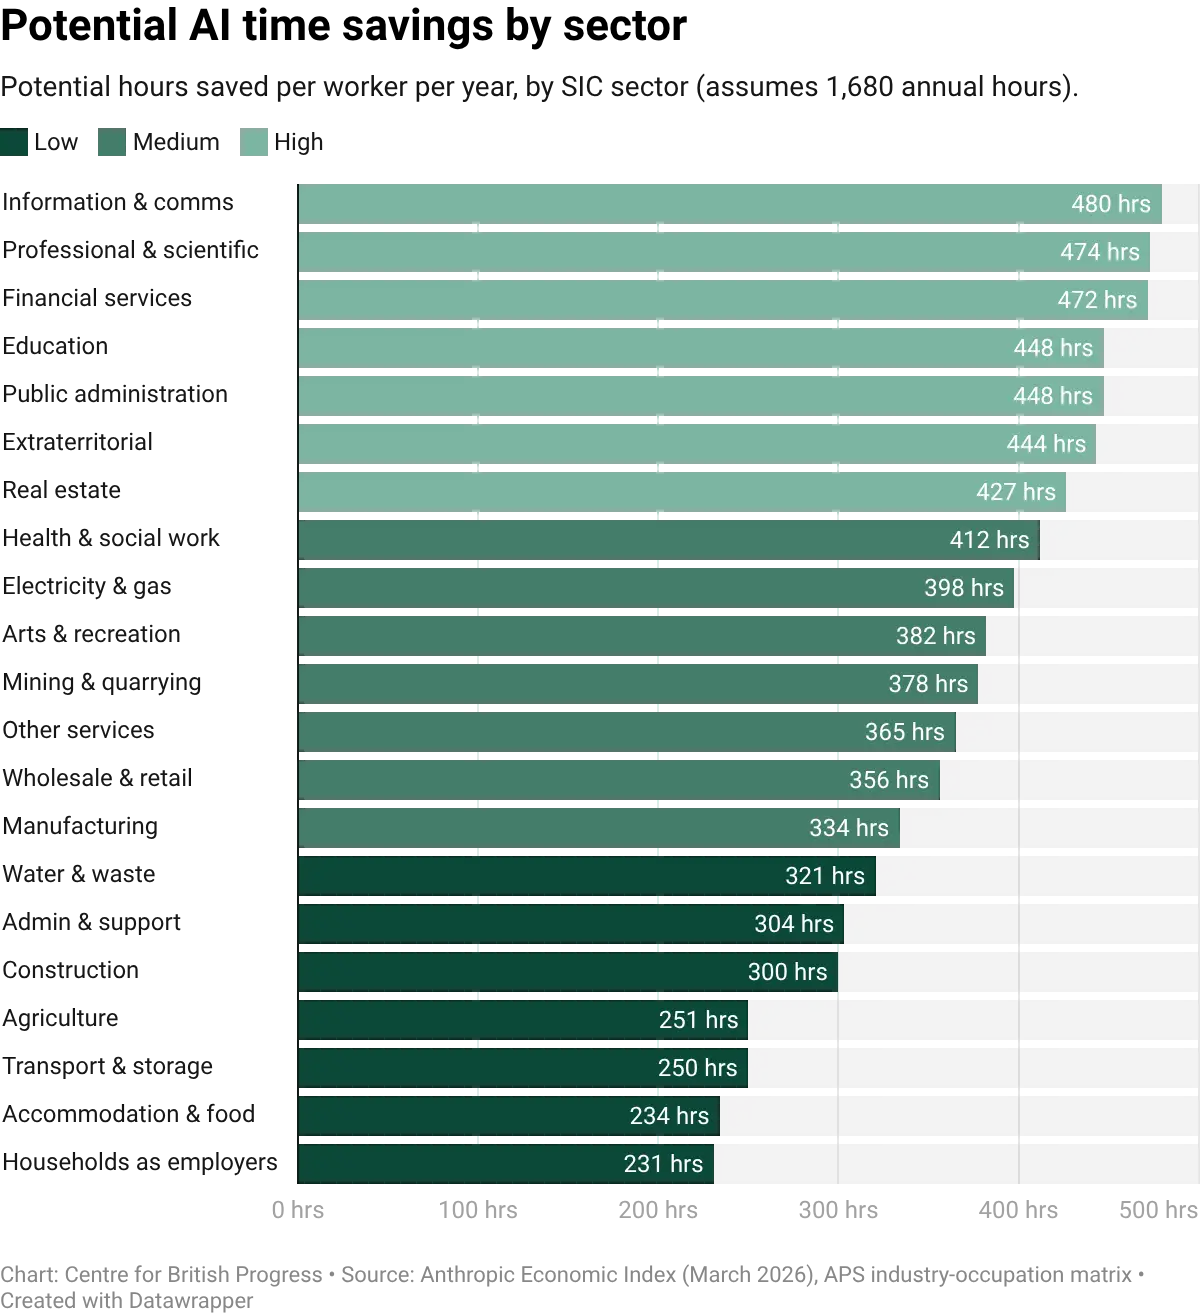
Unsurprisingly, estimated time savings from AI adoption vary across sectors. The sectors with the highest predicted exposure are also those where the estimated time savings per worker are largest, but the relationship is not one-to-one. Some sectors with moderate exposure scores show large potential time savings because their exposed tasks are time-intensive: health & social work sits mid-table on exposure but its time savings per worker rival those of the most-exposed sectors, because tasks like clinical documentation and care planning absorb substantial practitioner time. Others score higher on exposure but involve tasks where AI assistance saves relatively little time per instance: real estate is among the most-exposed sectors, but many of its AI-relevant tasks (property listings, brief client correspondence) are short to produce with or without AI, which keeps per-instance gains modest even as aggregate savings remain meaningful. The distinction matters for forecasting productivity effects: exposure measures the breadth of contact with AI, while time savings measure the depth of potential impact per task.
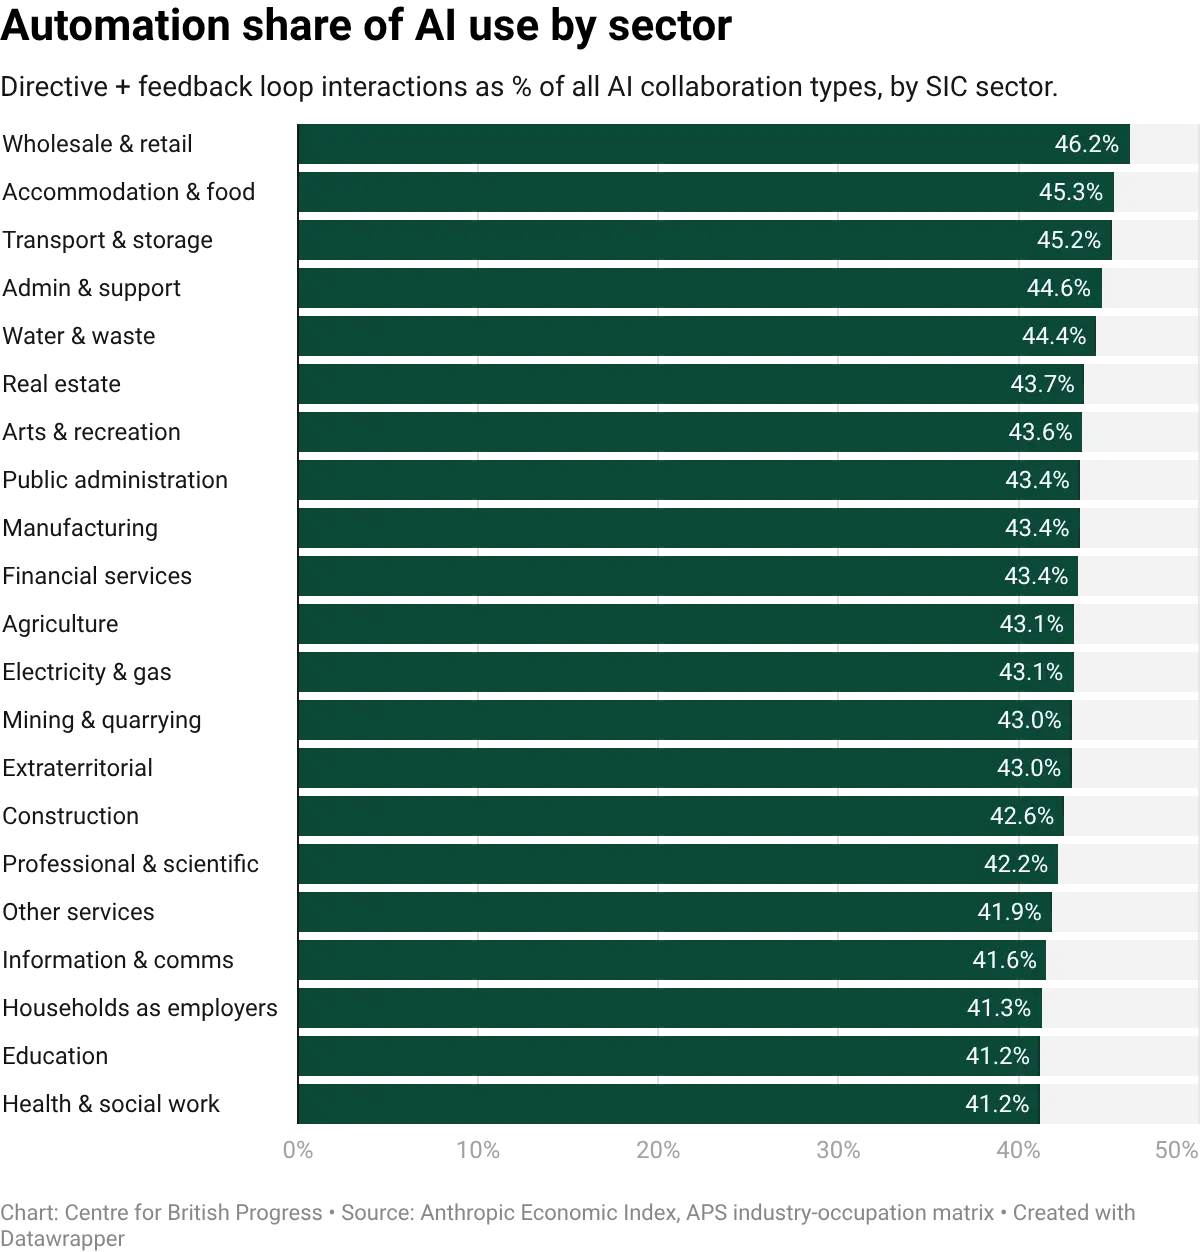
The balance between automation and augmentation also varies by sector. Classifying each sector's AI interactions by whether they are directive and feedback-driven (automation) or collaborative and iterative (augmentation) shows that no sector is dominated by automation. In every case, augmentation accounts for the majority of interactions. But the ratio varies: sectors with a higher share of routine cognitive tasks (wholesale and retail, accommodation) tilt more toward automation, while sectors with a higher share of analytical and creative tasks (health, education, professional services) tilt more toward augmentation. Supermarkets and hotels are therefore more likely to automate tasks with AI, while hospitals, schools, and law firms are more likely to use it to augment the work of existing staff.
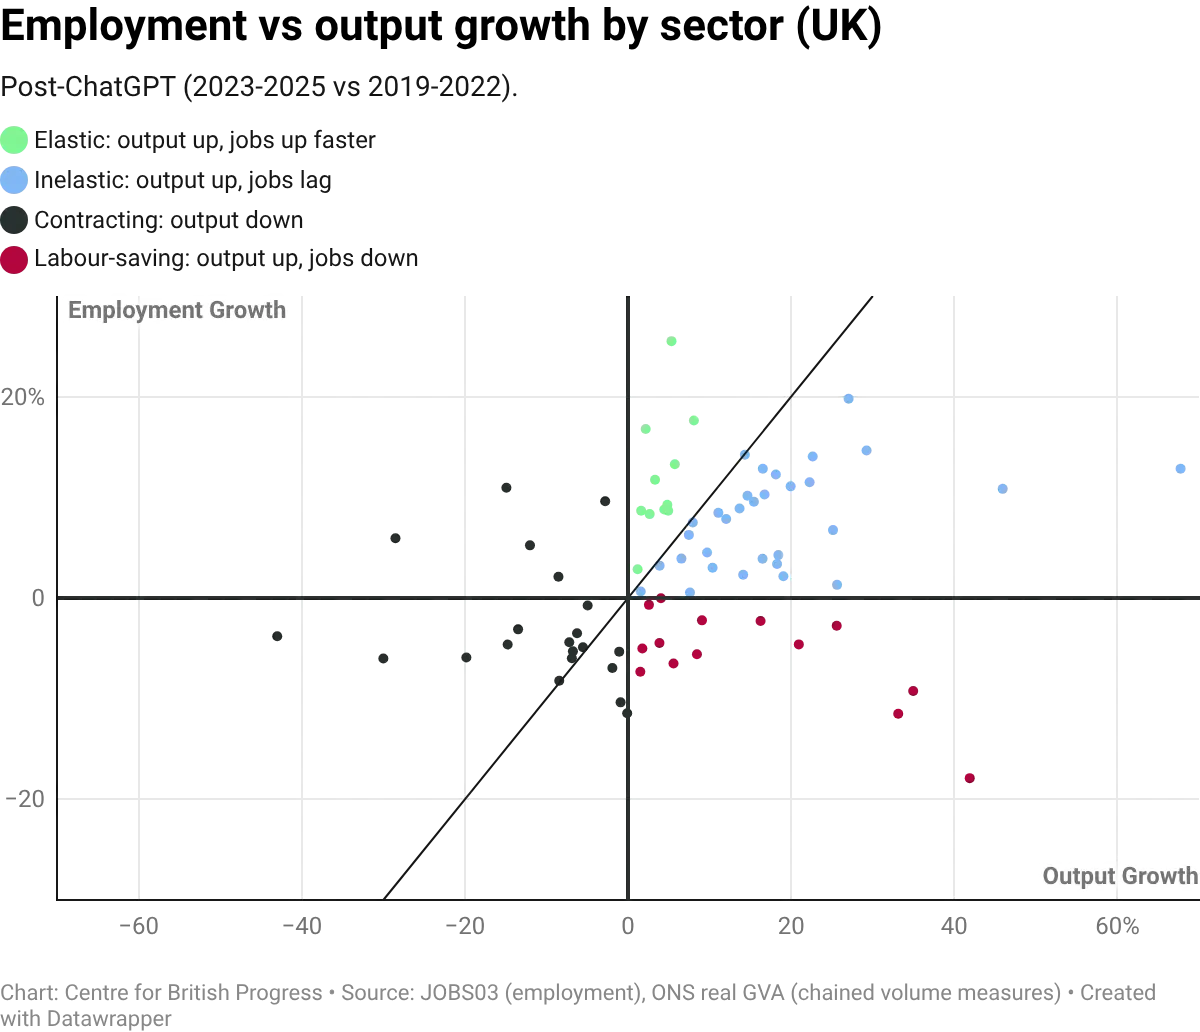
Whether a sector sheds or creates jobs in response to productivity growth depends in part on the elasticity of demand for its output. Economist James Bessen shows that in sectors where demand is elastic, automation-driven cost reductions can lead to net job creation because the expansion of output outweighs the labour saving per unit. Retail banking is a classic example: the introduction of ATMs cut the cost of running a branch, banks opened more branches, and bank-teller employment kept growing for two decades before eventually tapering.
Medical imaging looks like a similar story under generative AI. Despite machine-learning models outperforming radiologists on diagnostic benchmarks since the mid-2010s, US radiology residency positions reached a record 1,208 in 2025, vacancy rates are at all-time highs, and average radiologist compensation has risen 48% since 2015 to $520,000. Only 36% of a radiologist's time is spent on direct image interpretation, and imaging utilisation has risen 60% since digitisation. Cheaper image reading has expanded total demand for imaging rather than cut headcount.
In sectors where demand is inelastic, the labour saving dominates and employment falls. Routine clerical work sits closer to this case: each firm needs roughly the same amount of administrative processing regardless of how cheap it gets, so automating it cuts headcount rather than growing the market.
Plotting employment growth against real output growth across UK sectors can help us identify which pattern is at work. Many sectors cluster along a positive slope: output growth and employment growth move together, consistent with elastic demand. A few show output growth combined with flat or declining employment, the inelastic pattern. Computer programming (SIC 62), one of the more prominent sectors in terms of exposure to AI, sits in the inelastic quadrant. This means that while there is a positive relationship between measures of output and employment growth, employment may grow by less than the underlying productivity growth.
Whither software?
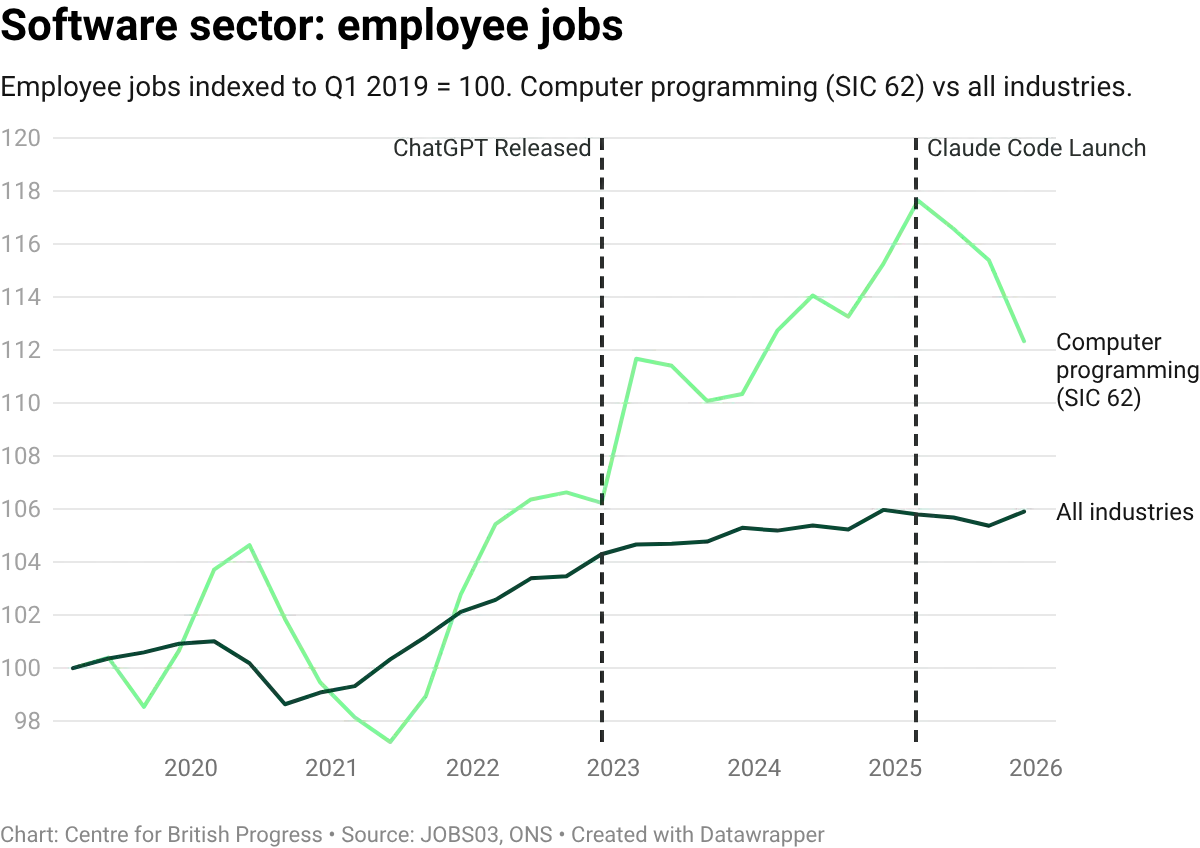
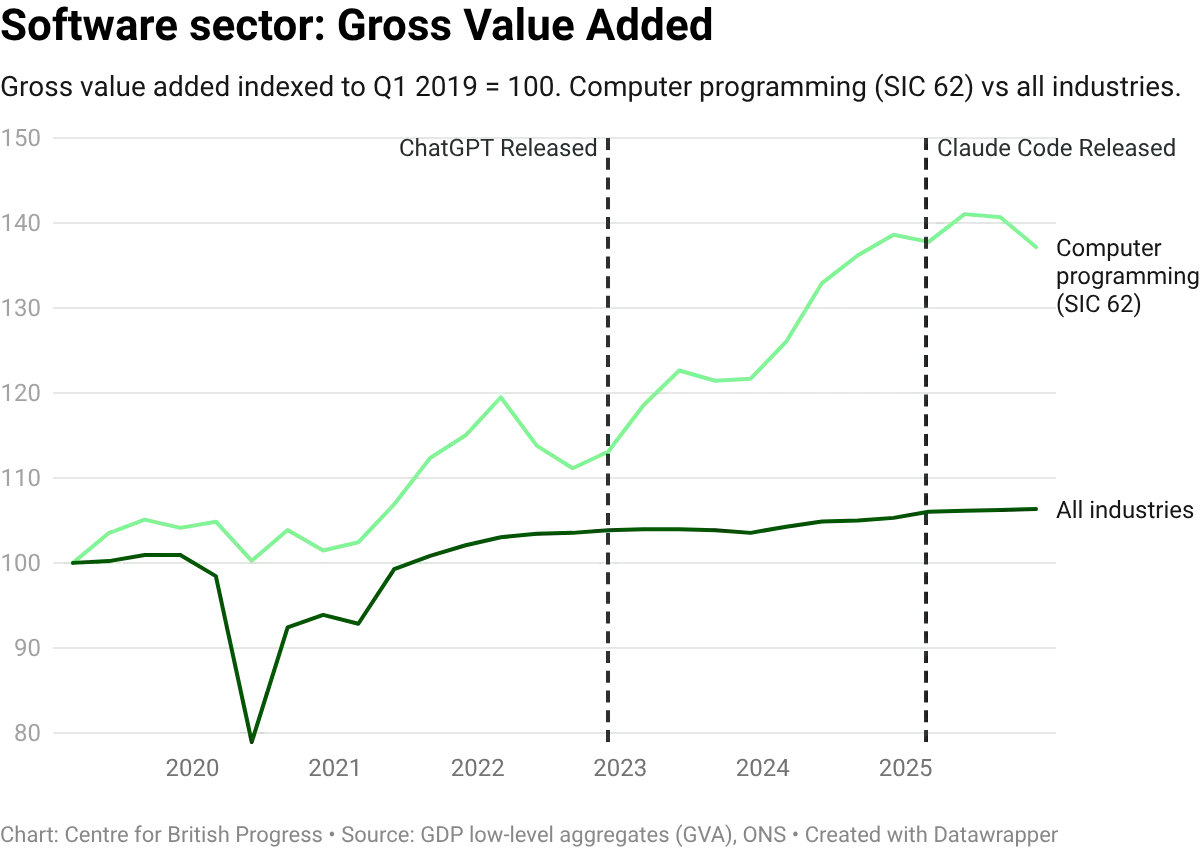
Software illustrates the pattern in a microcosm. Employment in the computer programming sector (SIC 62) grew by 18% between 2019 and 2025, roughly three times the economy-wide rate of employment growth, while output grew even faster, at 36% over the same period. But both series turned down in the second half of 2025: employment fell 4.5% from its March peak, and GVA dipped from its Q2 high. While the sector remains well above its pre-pandemic level, the timing coincides with both a broader technology-sector correction and the introduction of tools like Claude Code that can automate large amounts of tasks.
Vacancies have fallen from their 2022 peak, and the overall composition of IT roles has shifted toward higher-level tasks. On the whole, the sector appears to have inelastic demand: AI-driven cost reductions are expanding the market for software rather than shrinking the overall workforce, albeit less slowly than output growth. These trends may have partly reversed more recently, a development which coincides with the release of, but there isn’t yet enough data to suggest either that it is a causal pattern nor a persistent one.
This data point is likely the strongest kernel of evidence of any displacement effects of AI, but it is complicated by that decline coinciding with a reduction in the GVA of the sector. We should be mindful not to overanalyse a single data point that may well be revised in subsequent releases, but it is clear that the data point that would most clearly signal the beginning of the displacement of output cannot be cleanly reconciled with an account of increasing productivity leading to higher output and lower employment.
Economist James Bessen argues that software is a sector with elastic demand: when AI reduces the cost of producing code, firms buy more of it, and employment grows even as output per worker rises. The US figures he reports fit that description, with output, productivity, and developer employment all expanding since the release of ChatGPT (US developer employment alone has added roughly 400,000 jobs, a 20% gain).
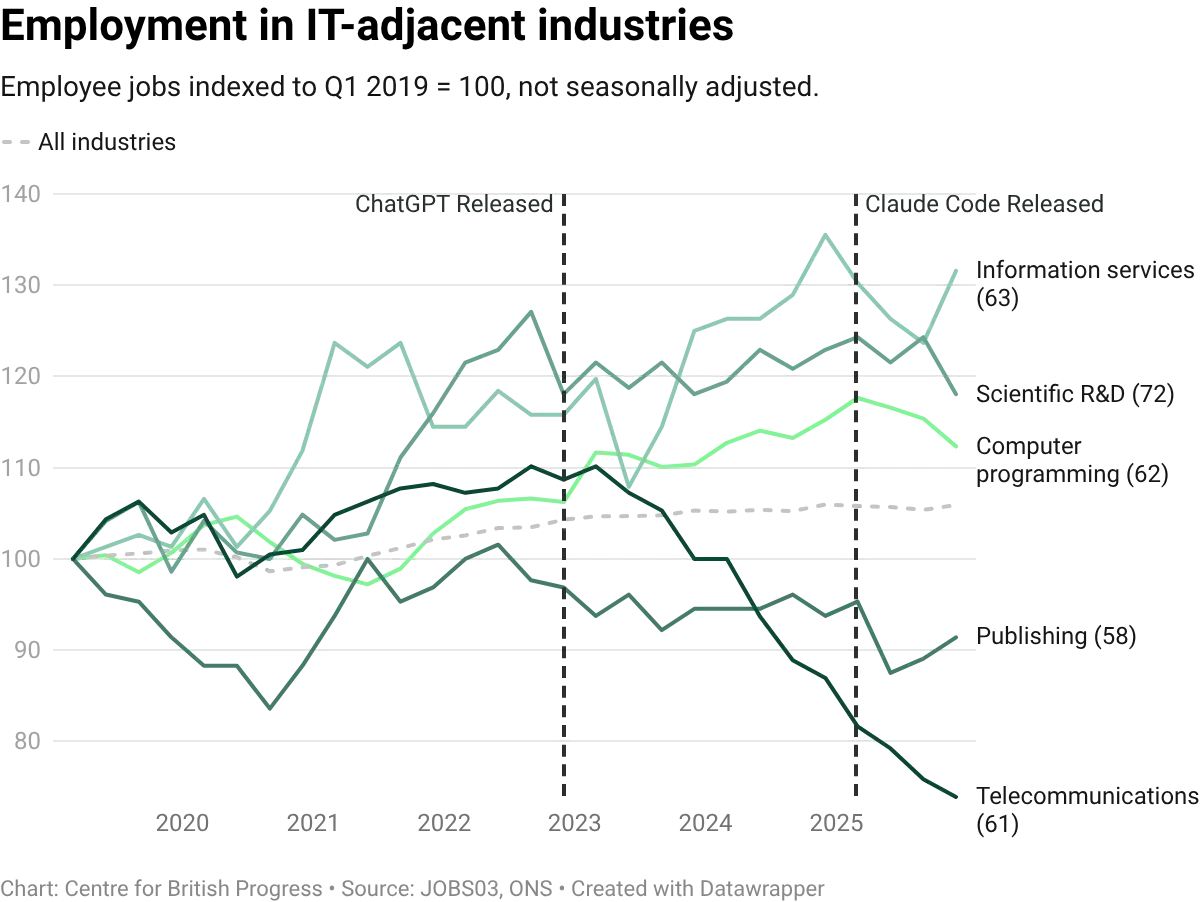
The UK picture is broadly consistent but at lower magnitudes, and with one important qualification: while SIC 62 output and employment both grew strongly through 2024, the employment response to output expansion has been weaker than in the US, placing UK software in the inelastic quadrant of the within-sector scatter shown earlier. Both UK series declined in tandem over recent months. Comparing SIC 62 against adjacent IT divisions (telecommunications, information services, publishing) helps contextualise the scale: computer programming has still outpaced some of these.
Overall, productivity within the sector has grown substantially faster than in the wider economy: GVA per worker in SIC 62 has risen by roughly 17% since 2019, against approximately 0.4% for the whole economy. The pace has accelerated from around 0.8% a year pre-ChatGPT (2003 to 2022) to around 3.8% a year since, a profile broadly similar to the acceleration Bessen reports for the US (from 3.9% to 6.0% a year), though from a lower starting base. The recent decline in GVA in the last two quarters complicates a clearer story of AI-enabled acceleration of productivity, but this remains the most likely candidate for an early sign of labour market impacts from AI-driven automation.
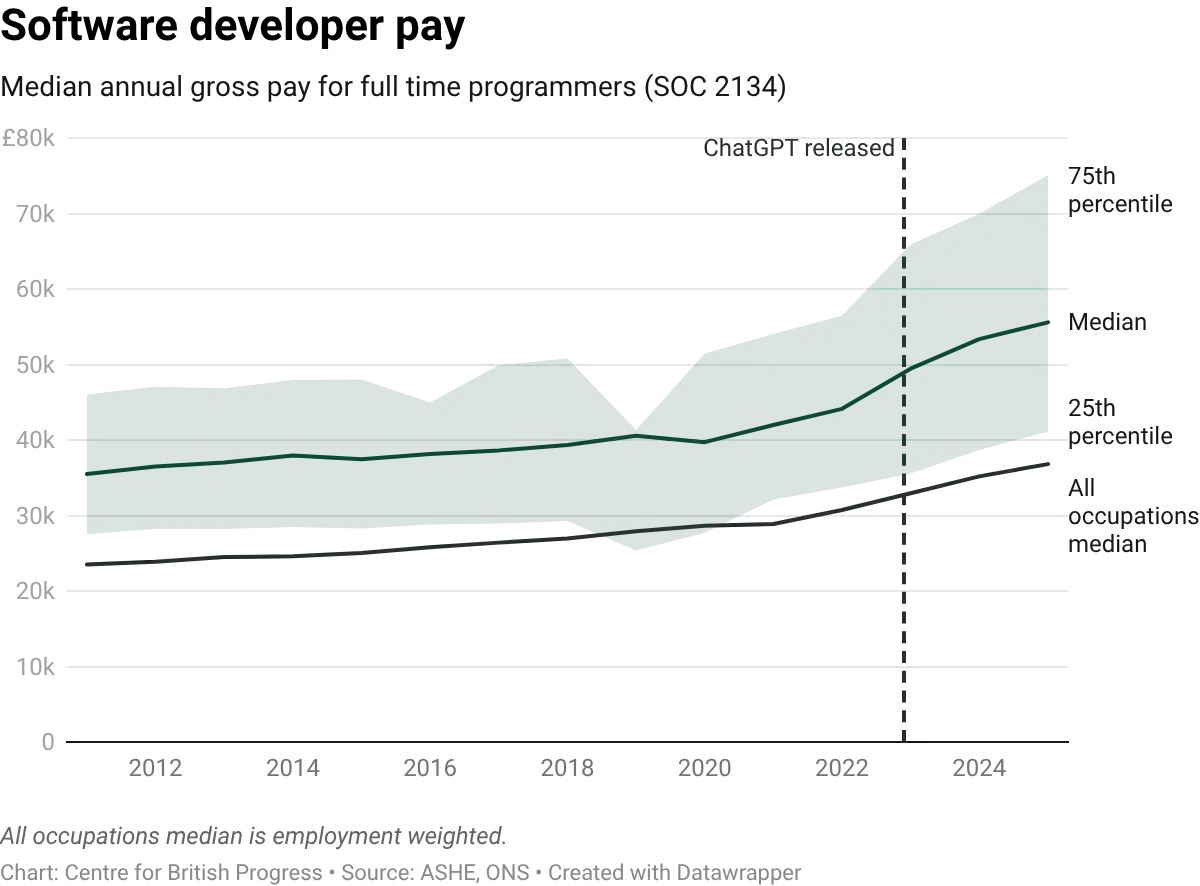
Wage data for the software sector broadly tracks these patterns, and provides additional evidence that the expansion in these roles was driven by greater demand for these activities before the recent decline. Median pay for programmers grew in line with the all-occupation average through 2021, and then accelerated. The timing is consistent with the broader post-pandemic tech-sector salary surge, but the latest decline hasn’t been captured yet.
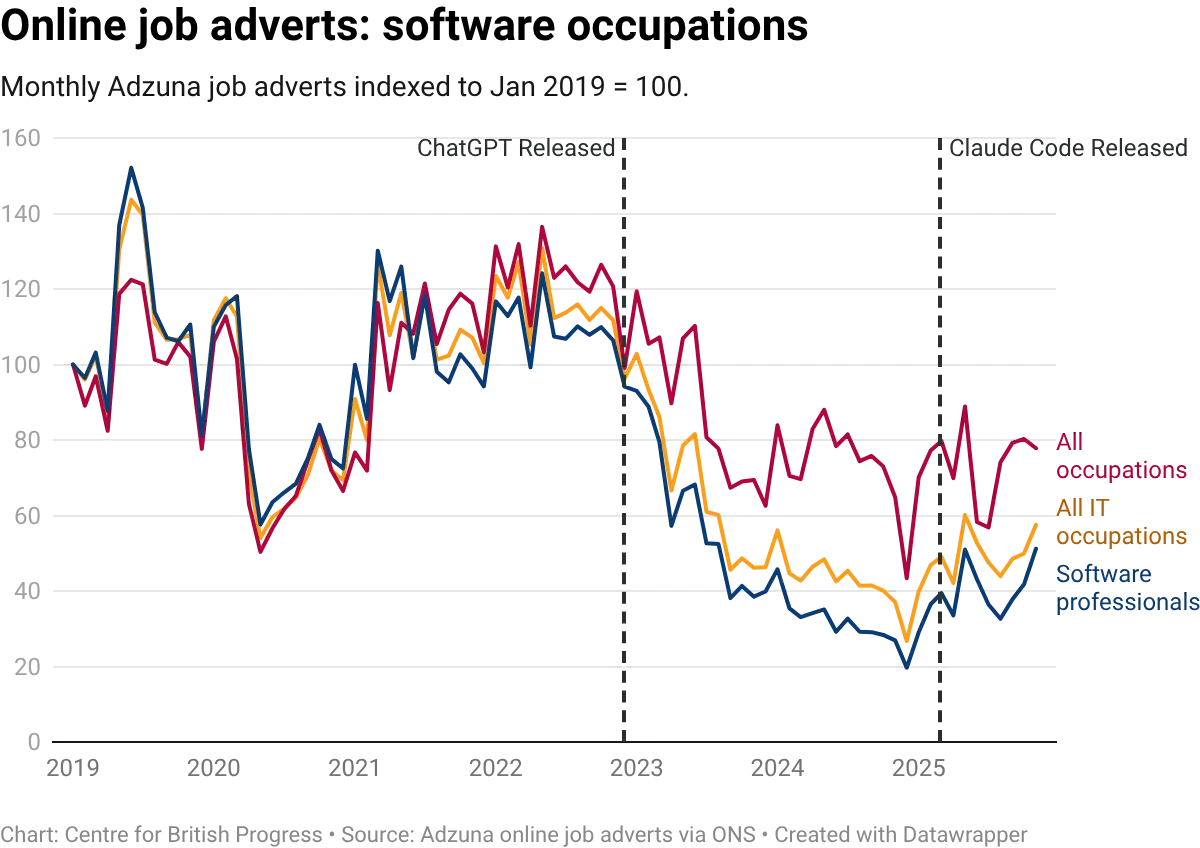
Vacancy data adds a different demand-side perspective. Job adverts for software roles surged through 2021 and 2022, but have since fallen back sharply. By late 2025, monthly job adverts for UK software occupations had fallen to roughly a third of their 2022 peak and to roughly a third of their 2017-2019 pre-pandemic level. The decline is consistent with a broader tech-sector correction, and with AI tools reducing the number of programmers needed per unit of output. The two explanations are not mutually exclusive. But while this decline has been felt more sharply for these occupations, the wider decline of vacancies across the entire economy is more suggestive of a more stagnant labour market, where fewer vacancies are being created in general, or at least less well captured by standard measurements. It is possible that weaker economic conditions since late 2022 have contributed to a weakening of broader recruitment channels and increased in importance for informal recruitment networks.
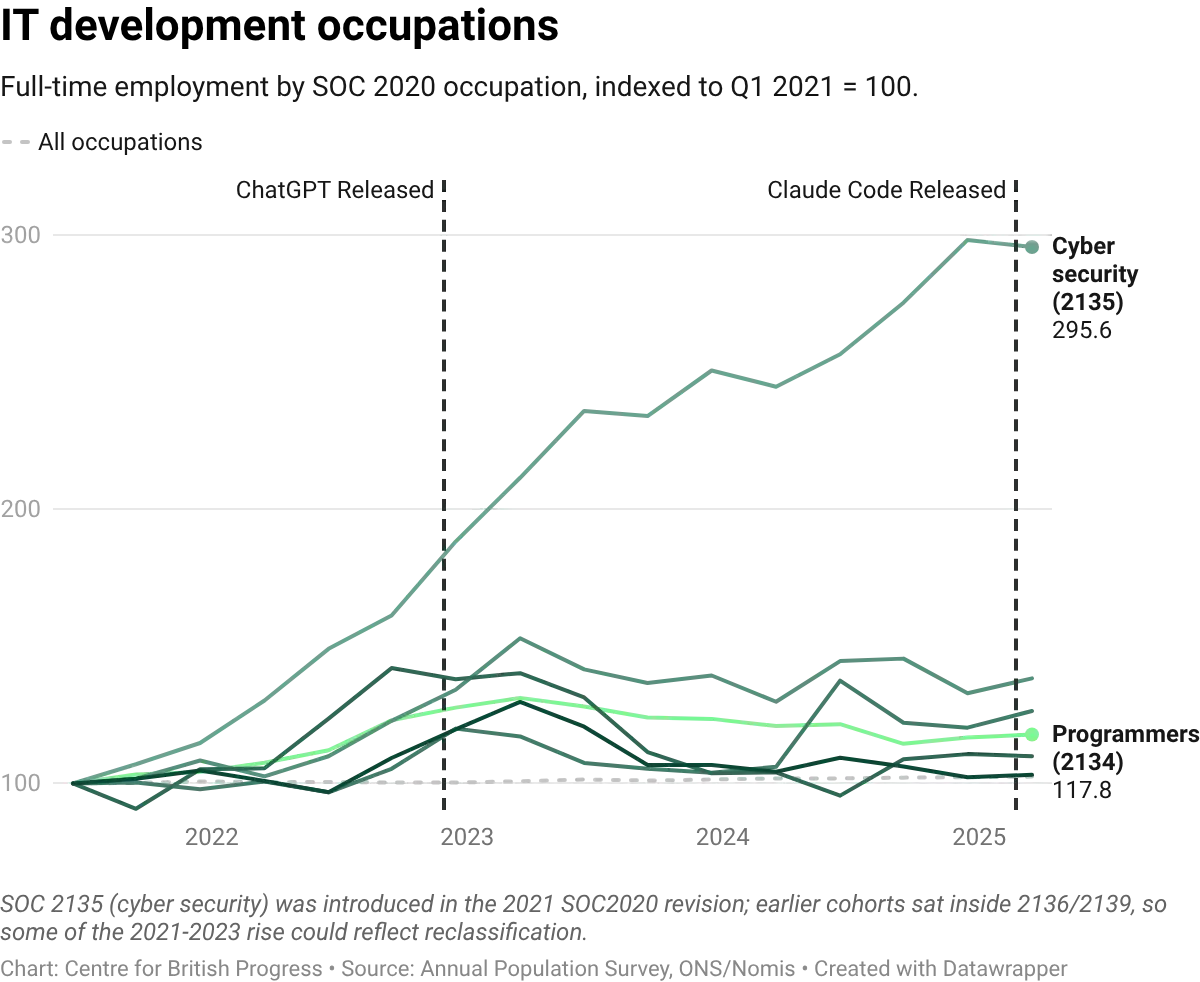
Moving on from sectors to occupations, the breakdown between development and management within IT roles provides a further test. If AI is automating routine coding tasks, demand should shift toward roles that involve system design, architecture, and oversight rather than direct implementation. The data shows both categories growing, but cyber security and business analyst roles have outpaced programmer roles since 2023. The divergence is modest but the direction is consistent with AI shifting the composition of software work toward design, analysis, and security, and away from direct coding. It may be the case that the launch of generative AI tools affected direct-implementation roles (programmers and developers) disproportionately, slowing their growth relative to the roles that supervise, specify, or secure the work.
This matters because sectoral reallocation is the mechanism through which aggregate employment historically recovers from (or weathers) automation shocks. If workers displaced from exposed occupations move into less-exposed sectors, the aggregate effect is muted, even if individual occupations contract or even disappear. The sectoral data so far is consistent with this pattern: parts of the economy are absorbing AI adoption without meaningful effects at either the sectoral or occupational levels.
Previous general-purpose technologies produced sharp occupation-specific declines even while aggregate employment held up. Travel agents were a predicted casualty of the internet, and they were: US travel-agent employment rose to a peak around 340,000 in 2000 then fell by roughly 60%. Unemployment in the occupation became more cyclically sensitive. Surviving agents moved upmarket, with wages rising from 87% of average weekly earnings in 2000 to 99% in 2025. Aggregate US employment recovered in parallel; age-adjusted employment rates today are close to the 2000 level. The recurring pattern is localised displacement, aggregate recovery through reallocation, and a policy problem that is less about mass unemployment than about easing occupation-specific transitions.
The most rigorous test of whether AI is specifically displacing programmers so far comes from analysis of US employment data. Leland Crane and Paul Soto, two economists at the Federal Reserve Board, tracked monthly employment of programming-intensive occupations over more than a decade. Their approach rests on a simple idea: if AI is reducing demand for coders specifically, then coder employment should be falling relative to what you would expect given the overall trajectory of the industries that employ them. A firm in the software sector might be growing or shrinking for many reasons (interest rates, product demand, post-Covid adjustment), but those forces should affect all workers in the firm roughly equally. If coders are losing ground within their industries, that points to something specific to the occupation rather than to broader economic conditions.
They construct a counterfactual series: what coder employment would have looked like if coders had simply maintained their share of each industry's workforce as those industries expanded and contracted. The difference between this counterfactual and actual coder employment captures the occupation-specific component, the part that cannot be explained by the performance of the industries coders work in.
Using data from 2014 to 2025 and a stable pre-Covid growth trend of roughly 5% per year, they find that coder employment growth has been approximately 3 percentage points per year lower than industry dynamics alone would predict since the release of ChatGPT. When they repeat the exercise for occupations with little AI exposure, there is no comparable deceleration, which strengthens the case that the coder result reflects something specific to programming-intensive work.
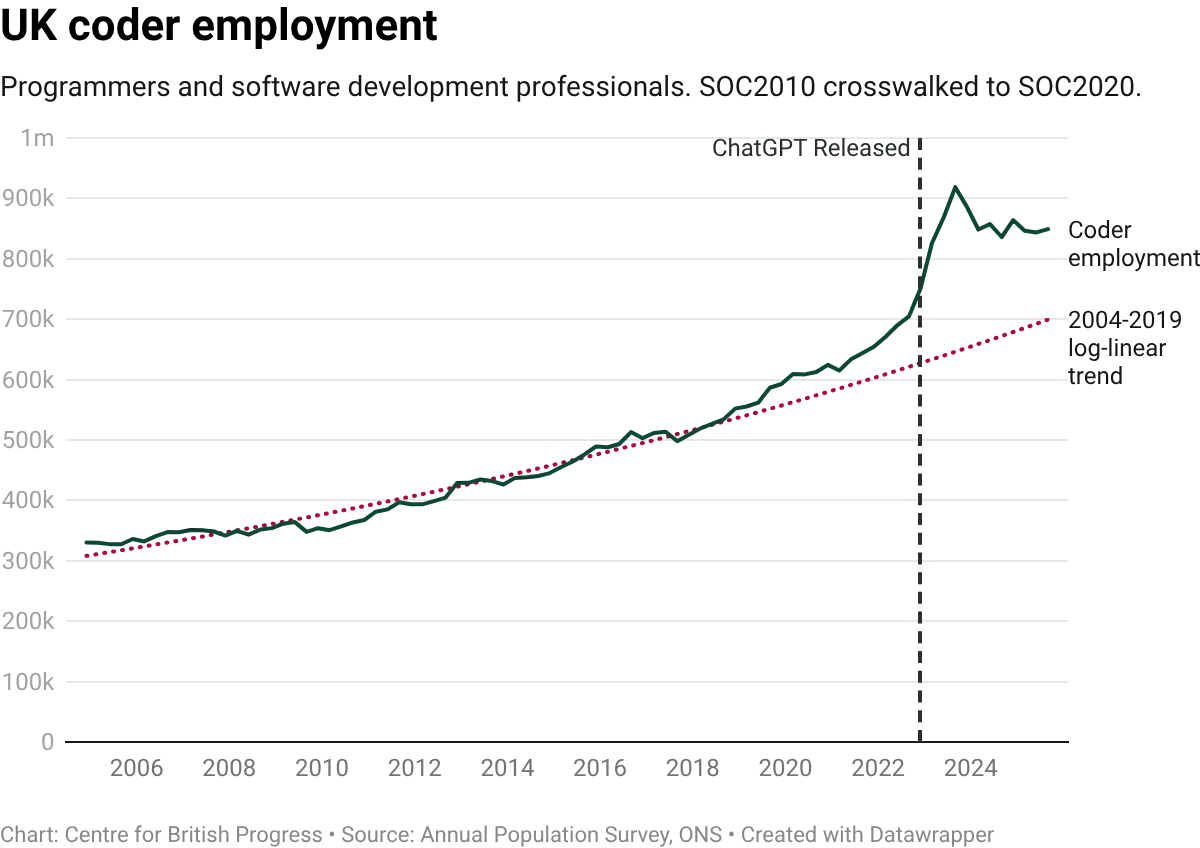
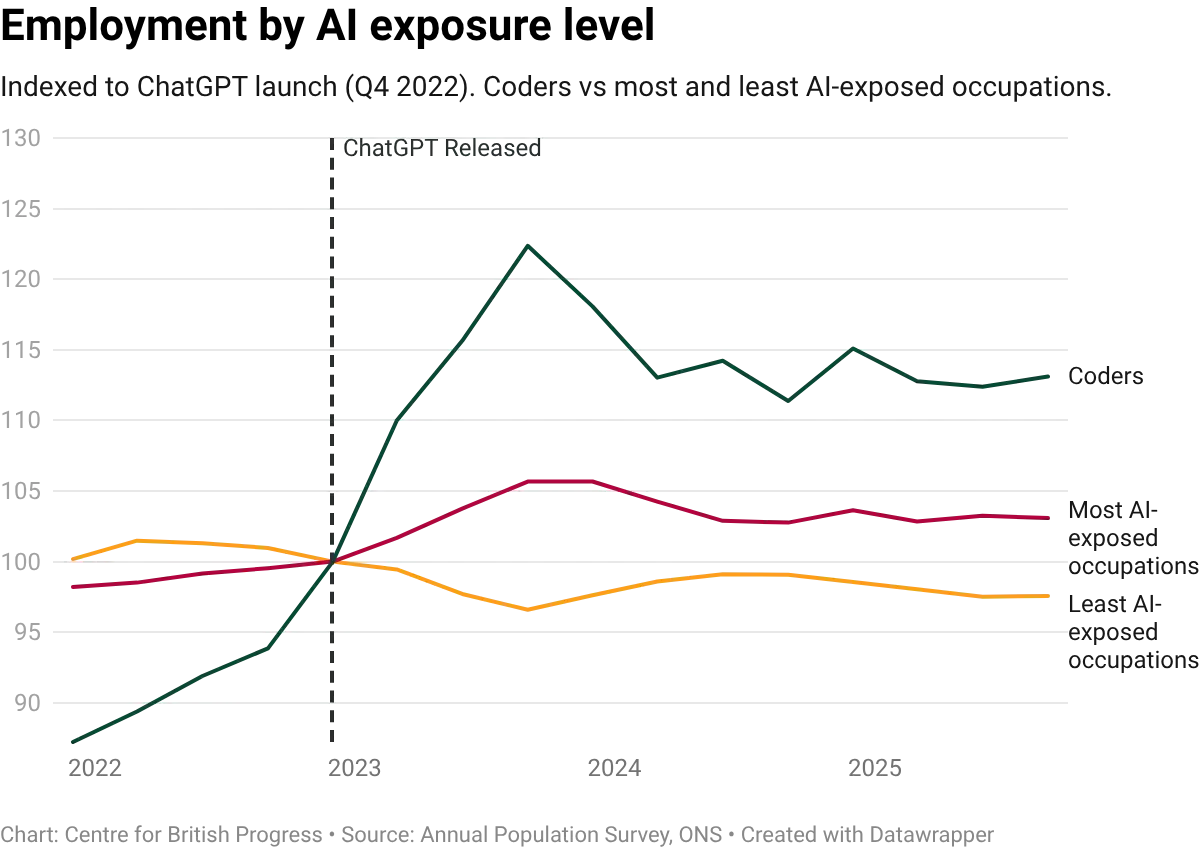
It is difficult to reconcile UK data with this finding. Published estimates from the Annual Population Survey indicate that coder employment in 2024 and 2025 sits well above its pre-pandemic trajectory. The 2004 to 2019 trend would place UK coder employment at roughly 700,000 by now, but actual employment is closer to 850,000. Where US coder employment flattened relative to its pre-Covid path, UK coder employment has overshot it. We should note that overall employment in this group of occupations has since declined at a level above the predicted trend. This is consistent with both a displacement story and an industry correction account, and we do not yet have the data to decisively distinguish between them.
We attempted to carry out the same decomposition on UK data, but the exercise faces several obstacles that do not arise with US data. The most fundamental of these is data coverage. The UK occupational classification system changed in 2021, and the mapping between the old and new codes is not clean enough to construct a consistent time series spanning both periods. This limits the usable panel to twenty quarters starting in 2021 Q1, compared with the eleven years available in the US. The entire pre-treatment window therefore consists of the post-Covid recovery, a period in which virtually every occupation was growing rapidly as the economy reopened.
This matters because the method works by comparing growth rates before and after ChatGPT's release. If the pre-treatment trend is inflated by recovery dynamics rather than reflecting structural growth, any return to normal will look like a deceleration, regardless of whether AI played any role. And that is exactly what we observe. When we apply the same decomposition to elementary occupations (cleaners, labourers, shelf-stackers) and to health professionals (doctors, nurses, therapists), both groups with negligible AI exposure, they show decelerations of comparable or greater magnitude to coders. The method would detect the economy normalising after the pandemic, not occupation-specific AI shocks.
We also tested whether the result changes when the Information and Communication sector is broken into its constituent parts (publishing, telecommunications, computer programming, information services) rather than treated as a single block. It does not. The UK Labour Force Survey also suffered from declining response rates over this period, adding further noise to the estimates, though we correct for this by normalising survey-based employment levels to the ONS Workforce Jobs series, which is benchmarked to administrative payroll data.
The contrast with the US finding may reflect several factors beyond data limitations. UK AI adoption, while broad across task types, is lower in intensity per worker. The UK software sector is structured differently: in the US, a single industry (computer systems design and related services) accounts for over 40% of all coder employment, creating a concentration that makes occupation-specific shocks easier to detect. No equivalent concentration exists in the UK.
The US result is itself subject to a contemporaneous confound: a 2022 change in US tax law raised the effective cost of R&D spending, which disproportionately affects coder-intensive industries. The UK experienced its own R&D tax changes over the same period, though the direction is less clear-cut. From April 2023, SME R&D relief was cut substantially, raising the effective cost of R&D for smaller firms. But relief for large companies was simultaneously made more generous. The net effect on coder demand depends on where those coders sit, making it difficult to use either country's data to cleanly separate an AI effect from a tax policy effect.
As more quarters of data accumulate beyond the 2021 classification break, the UK decomposition will become a cleaner test. For now, the aggregate evidence points the same way as the descriptive trends presented above: UK coder employment grew since the release of ChatGPT, and the sector appears to exhibit elastic demand. The data does not yet support the view that AI has displaced programming jobs in the UK labour market.
For more information about our initiative, partnerships, or support, get in touch with us at:
[email protected]For more information about our initiative, partnerships, or support, get in touch with us at:
[email protected]